Skip to content

One network instead of five vendors.

AZ-Five runs ingestion, pipelines, data quality, lineage, dashboards, product analytics and model monitoring as a single system, hosted and operated for you. The diagram below is the entire product.

STATIONS
30
LINES
6
VENDORS
1
  • Files CSV · Parquet · JSON
  • Databases Postgres · MySQL · BigQuery · Redshift · Snowflake
  • SaaS tools HubSpot · Chargebee · Google Ads · Sheets · more
  • Event SDKs Eight platforms, one tracking plan
  • Models ONNX, scored in place

ALL OF IT INTO ONE LAKEHOUSE · MANAGED · OPEN FORMATS

  • Data line 4 STOPS
  • Pipeline line 6 STOPS
  • Semantic line 5 STOPS
  • Product line 7 STOPS
  • Visual line 4 STOPS
  • Model line 4 STOPS

FREE TO START · UNLIMITED SEATS · NO CARD REQUIRED

The stack you're riding now doesn't interchange.

Five vendors, five bills, five ideas of the truth. Quality gets bolted on at the far end, where the best it can do is tell you a dashboard was wrong — usually after the decision it informed.

  • Ingestion

    schema drift between here and the warehouse

  • Warehouse

    no idea which loads went stale

  • Transformation

    silent nulls pass straight through

  • BI

    no lineage back into the numbers

  • Monitoring

    alerts arrive after the decision

NO INTERCHANGE BETWEEN ANY TWO OF THEM

Six lines, 30 stations, one operator.

Each line is a whole product a lean team would otherwise buy on its own. They share one storage layer, one catalog and one set of permissions, which is the only reason a number on one line can be trusted by another.

Data line

Every load arrives profiled, not just stored.

Upload a file, sync a database, or point a connector at a SaaS tool — it lands as a Delta table and is profiled on arrival. Rules run on a schedule with SLAs and a full pass/fail history, so a malformed load is caught at the door instead of on a dashboard three days later.

Replaces your warehouse and your data-quality vendor.

The data line in full
  • Datasets CSV, Parquet and JSON land as Delta tables, versioned from the first row.
  • SQL editor Full SQL over the lakehouse, executed by DataFusion in Rust.
  • Column profiling Nulls, distributions and distinct counts computed on every load.
  • Quality rules Not-null, range, freshness, volume and schema checks on a schedule.
  • Trusted tables
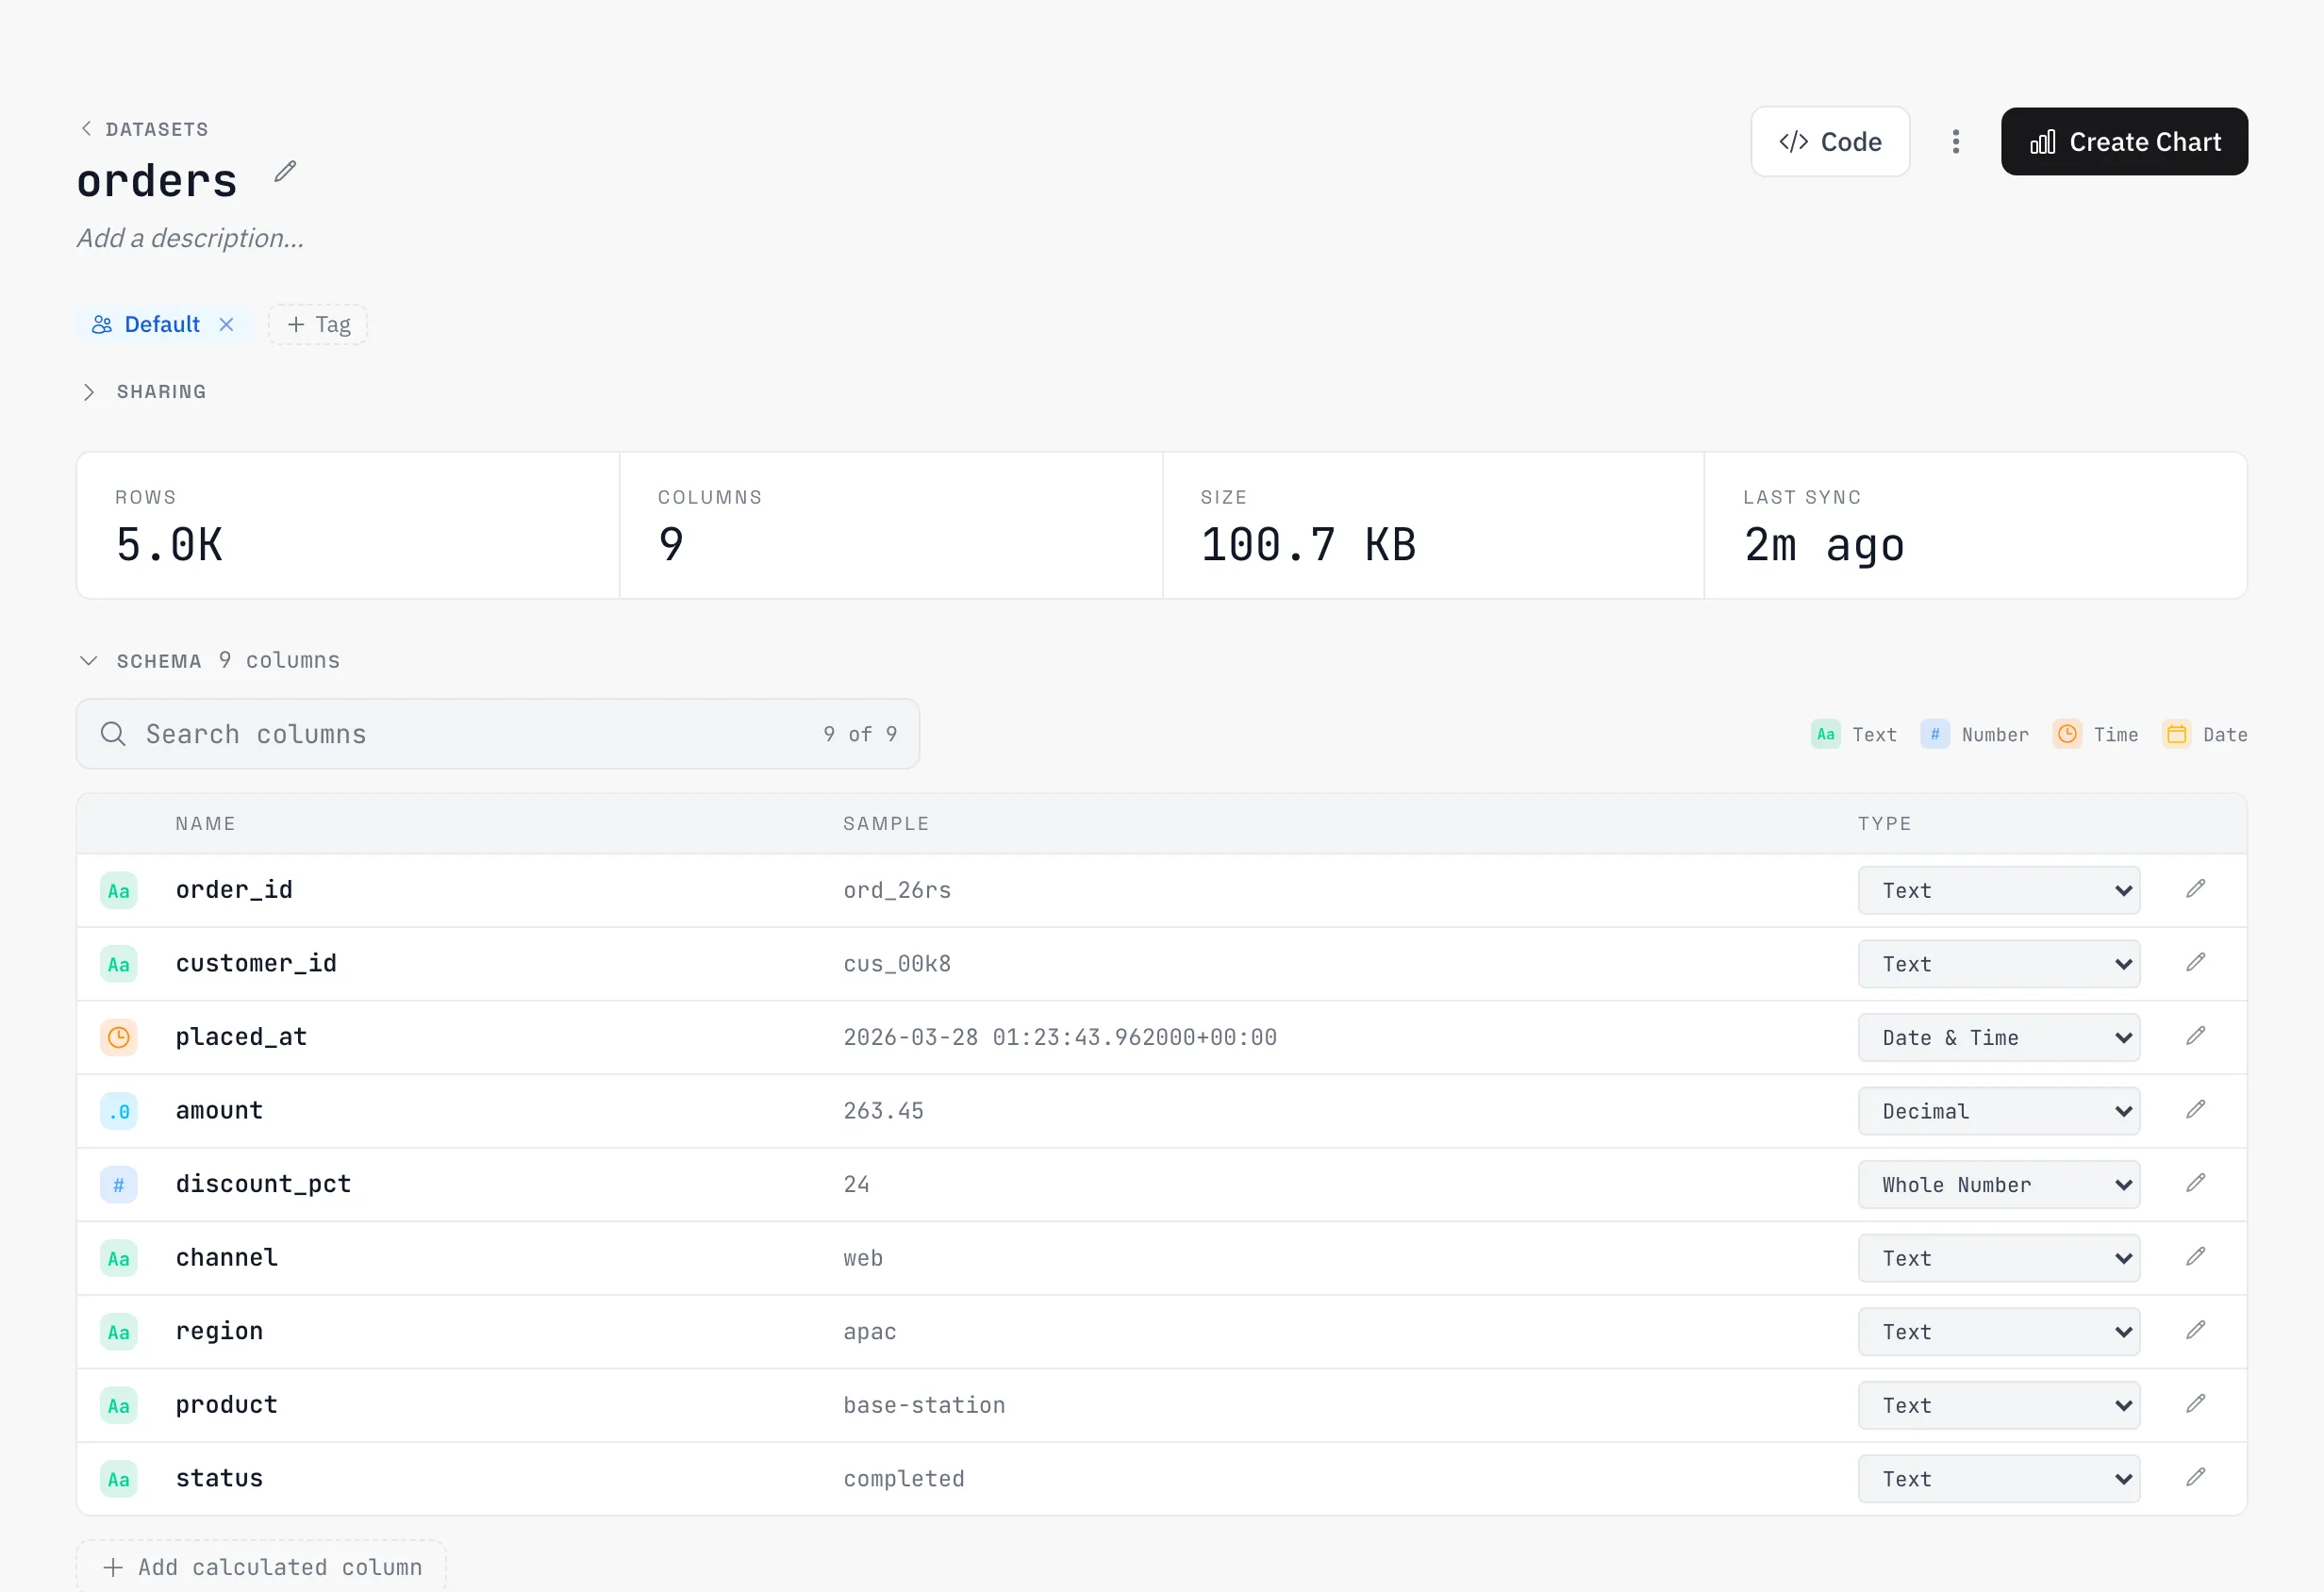
The orders dataset: schema, column types and sampled values
THE ORDERS DATASET: SCHEMA, COLUMN TYPES AND SAMPLED VALUES

Pipeline line

The orchestrator is in the box.

Most teams bolt a scheduler onto their analytics stack and maintain the glue forever. AZ-Five builds the DAG in: 28 task types across data, quality, ML, integration, notifications and logic, wired on a canvas, branching on success or failure. Because it lives with the data, a pipeline can be triggered by the platform itself — when a quality rule fails, when a connector sync breaks, when another pipeline finishes.

Replaces your orchestrator.

The pipeline line in full
  • DAG builder Drag tasks onto a canvas and wire them together. Each task configures itself from its own schema.
  • 28 task types SQL transforms, dataset writes, quality checks, model scoring, Slack, email, conditionals, loops.
  • Event triggers Run on a schedule, or when something happens — a failing quality rule can fire a pipeline.
  • Branch + retry Every task has success and failure outputs. Wire the failure path; set retries and timeouts per task.
  • Approval gates Pause a run until a person approves it. Nothing irreversible happens unattended.
  • Run history Every run snapshots its graph and records per-task timing, rows processed and logs.
  • Automated
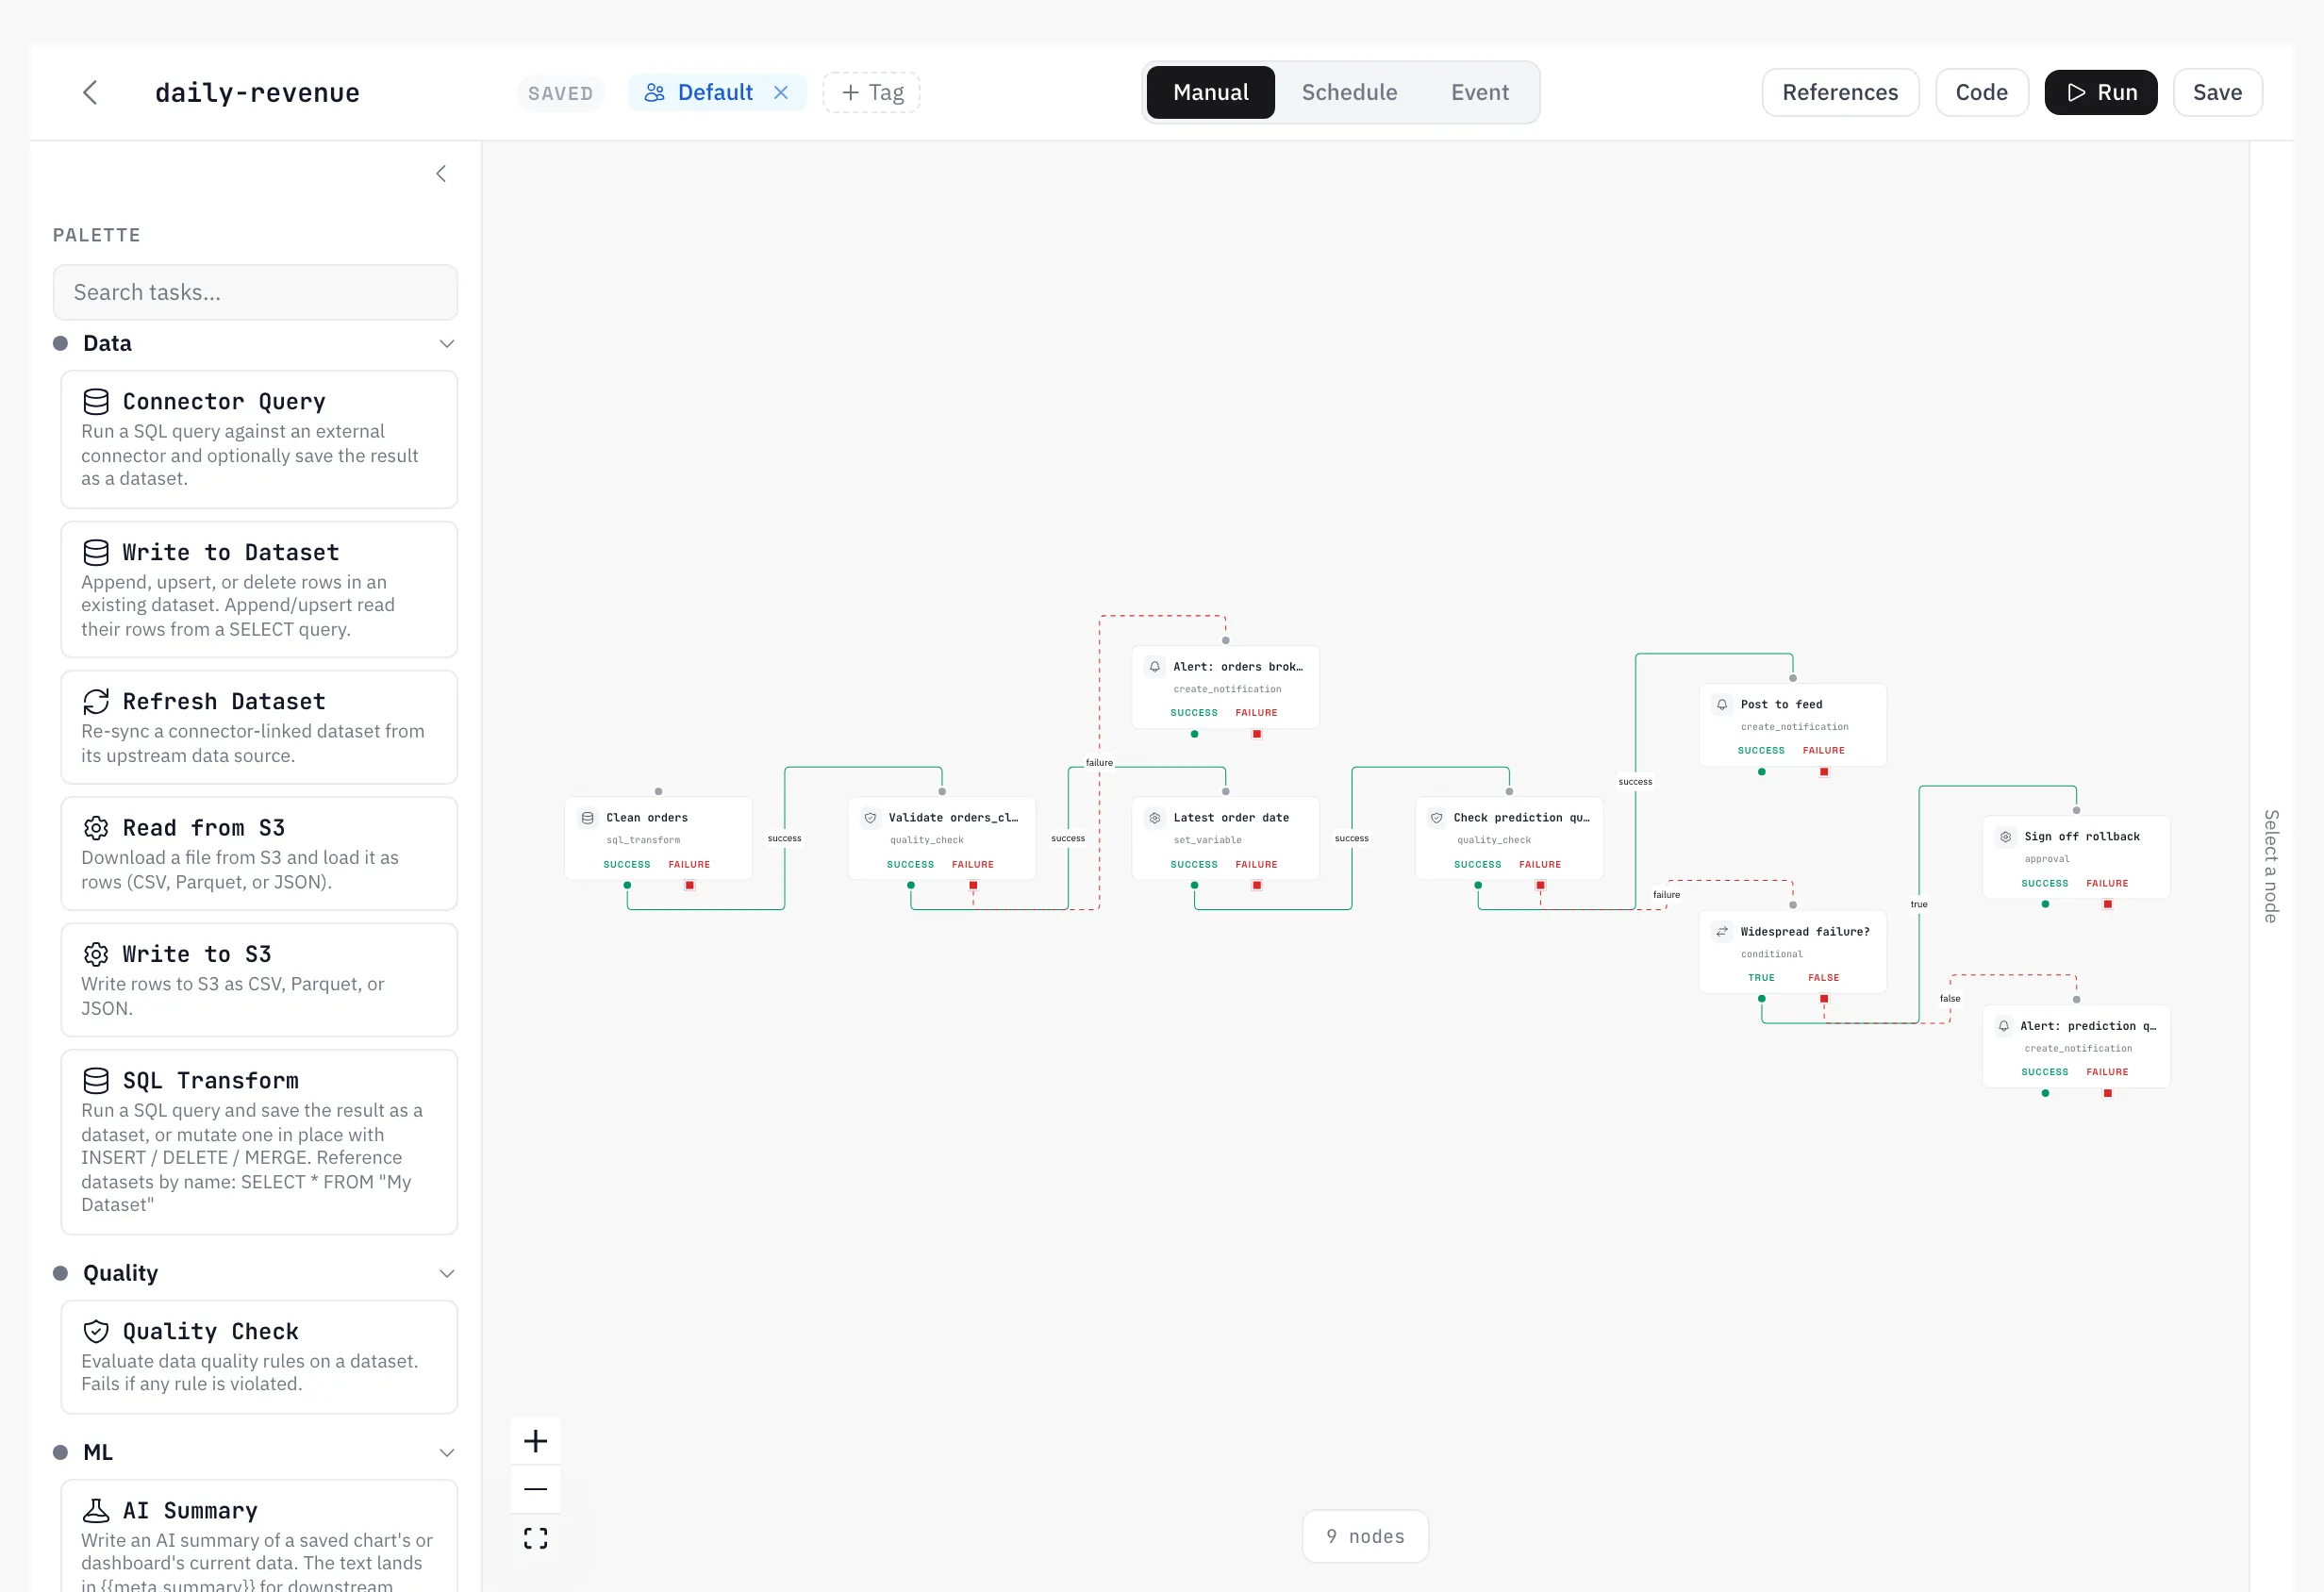
Pipeline builder canvas with a branching DAG and a failure path
PIPELINE BUILDER CANVAS WITH A BRANCHING DAG AND A FAILURE PATH

Semantic line

Data changes go through review, the way code does.

A measure is defined once and reused by every chart that needs it. Changing one opens a change request that shows the diff and the blast radius before anyone merges — which dashboards move, and by how much. Lineage connects each published number back through its chart and its measure to the raw source.

Replaces your transformation tool and your metrics layer.

The semantic line in full
  • Measures Metrics defined once in a governed catalog, reused everywhere.
  • dbt import Bring an existing dbt project in without rewriting it.
  • Branches Datasets, measures and dashboards live on branches, like code.
  • Change requests A diff plus the downstream impact — which numbers move, by how much.
  • Lineage Every number traced back through charts and measures to its source.
  • Governed metrics
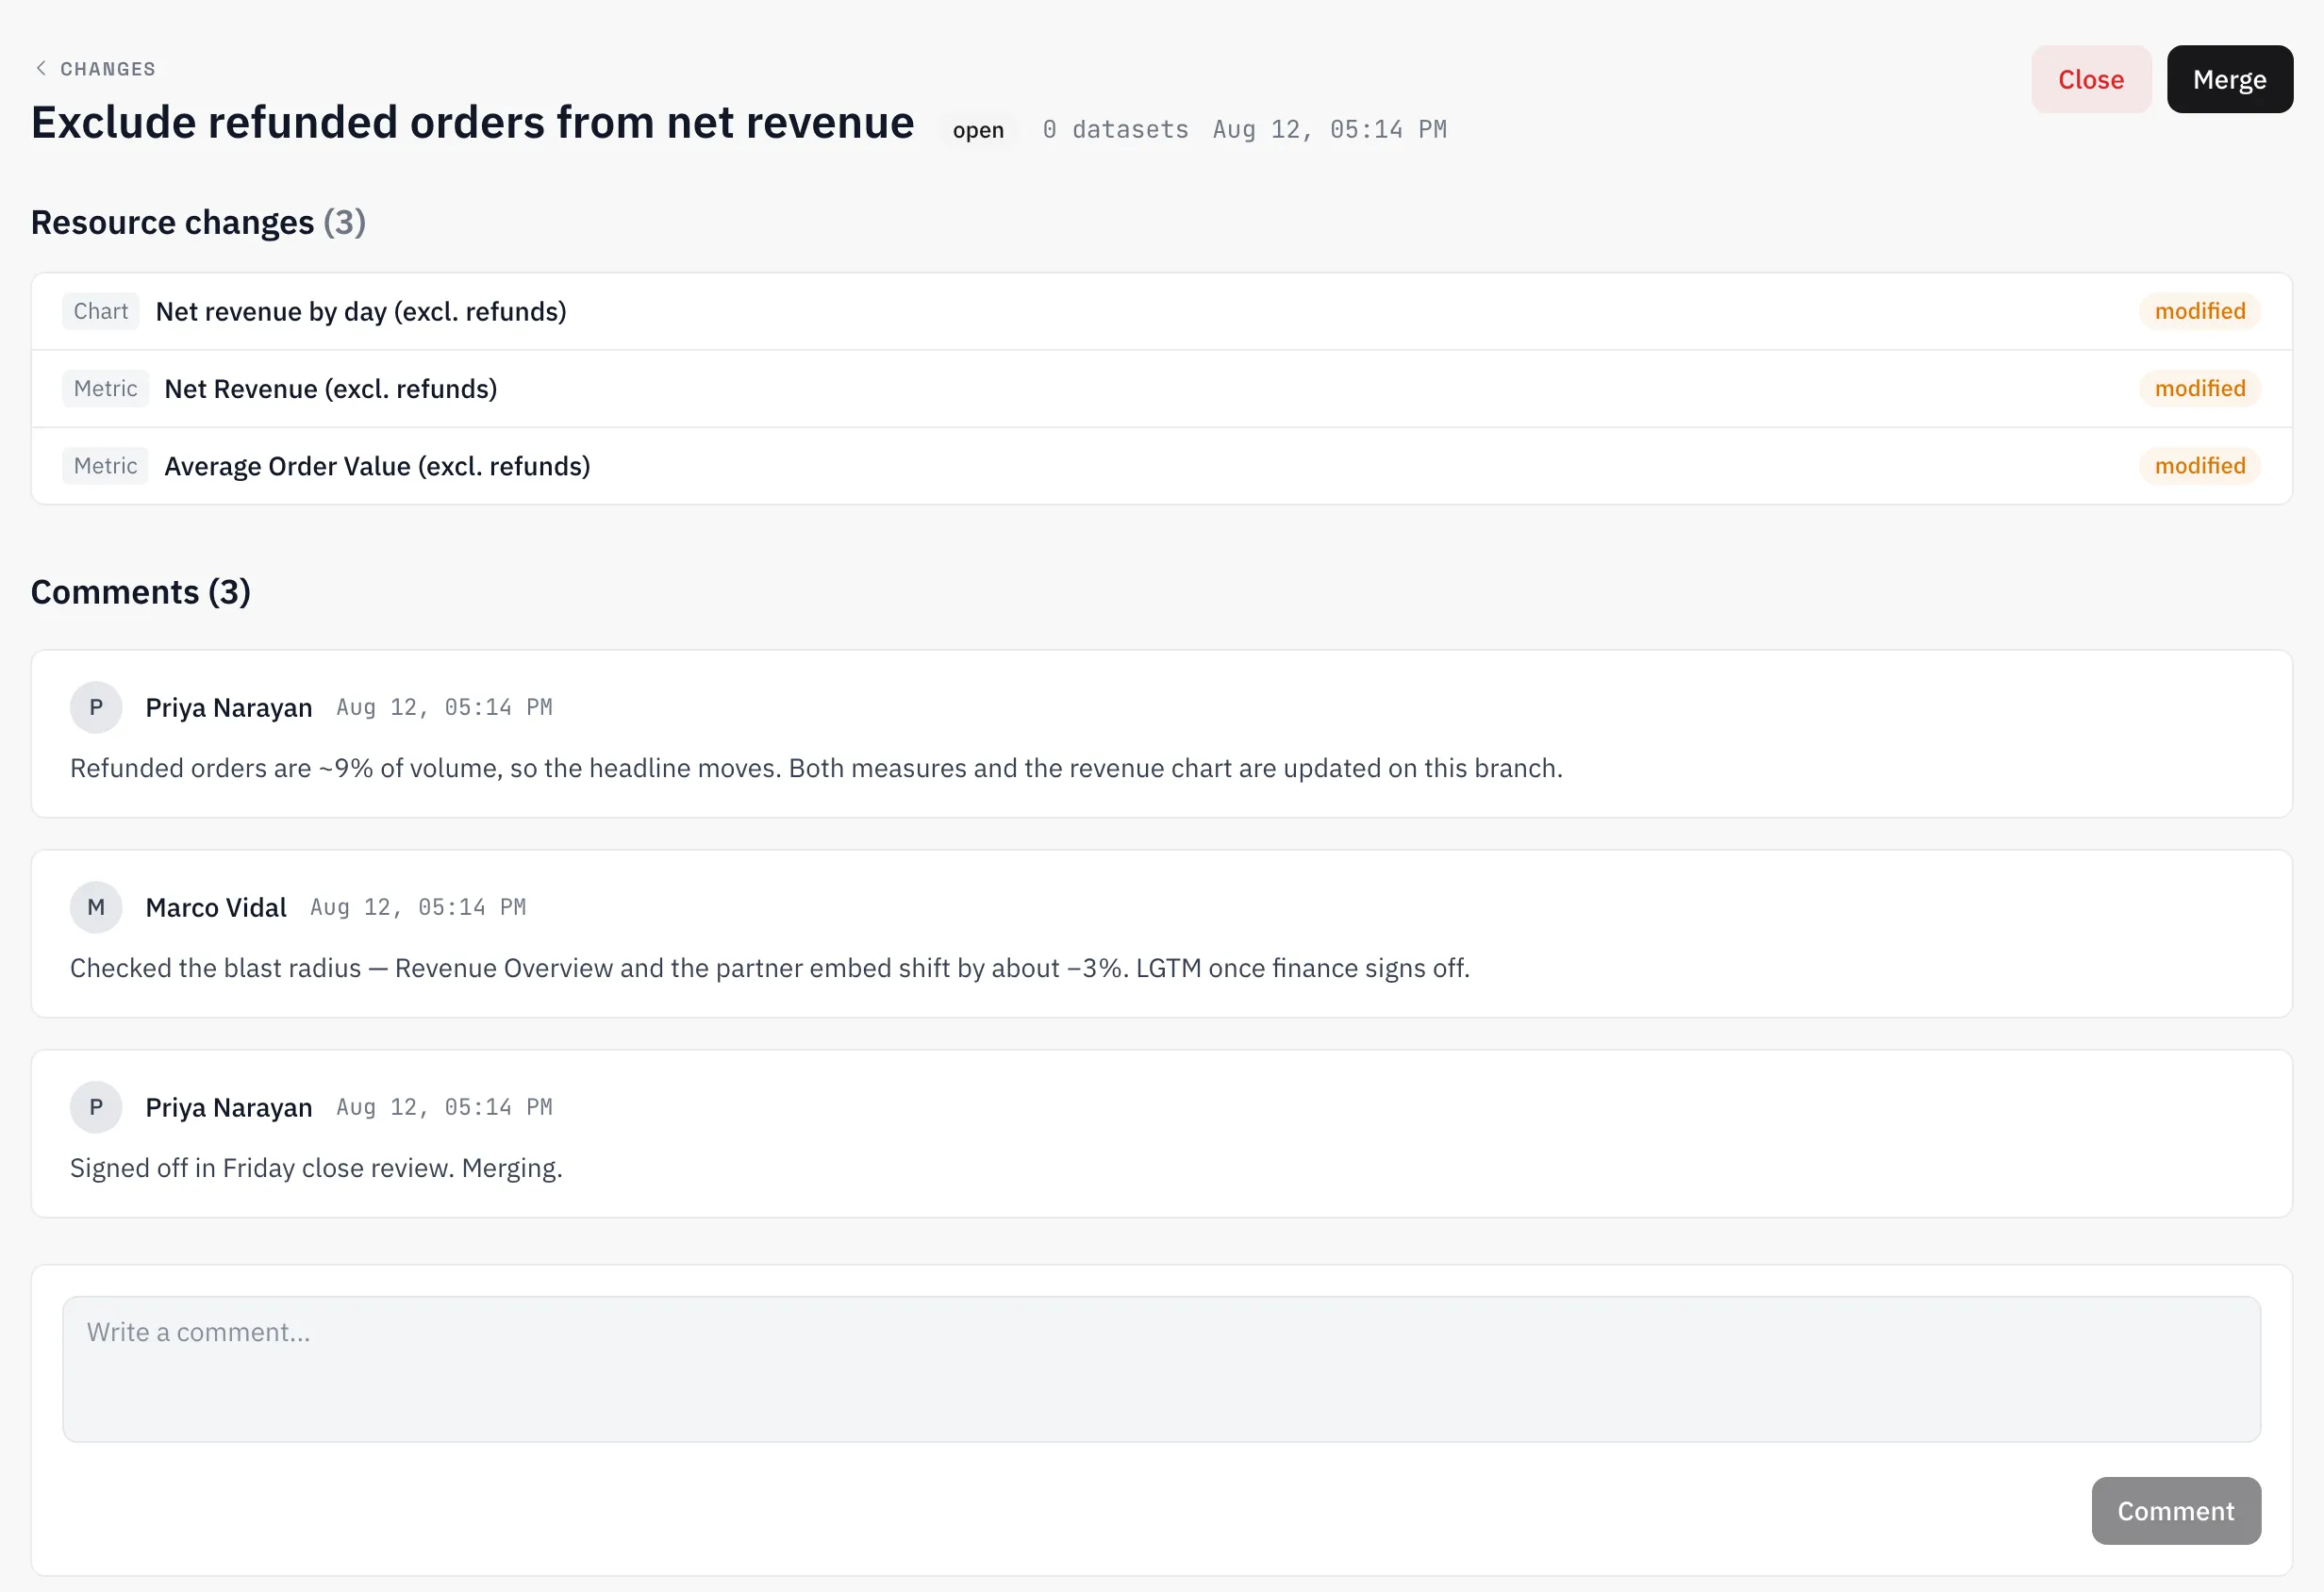
An open change request on the net_revenue measure
AN OPEN CHANGE REQUEST ON THE NET_REVENUE MEASURE

Product line

The whole product-analytics stack, on the same tables.

Events, funnels, session replay, feature flags, experiments and surveys — the things you would otherwise buy separately, reading the same governed measures as your revenue dashboard. The tracking plan is enforced at ingestion, so a malformed event never becomes a confident wrong decision.

Replaces your product-analytics vendor entirely.

The product line in full
  • Events Eight capture SDKs — web, iOS, Android, React Native, Flutter, Go, Python, JVM.
  • Funnels Conversion and retention over the same tables your BI reads.
  • Session replay Watch the real session behind a number.
  • Feature flags Targeted rollouts with exposure tracking built in.
  • Experiments A/B tests with honest statistics and no multi-variant leakage.
  • Surveys In-product questions, analysed in place.
  • Logs Live tail and structured search next to the events.
  • Product analytics
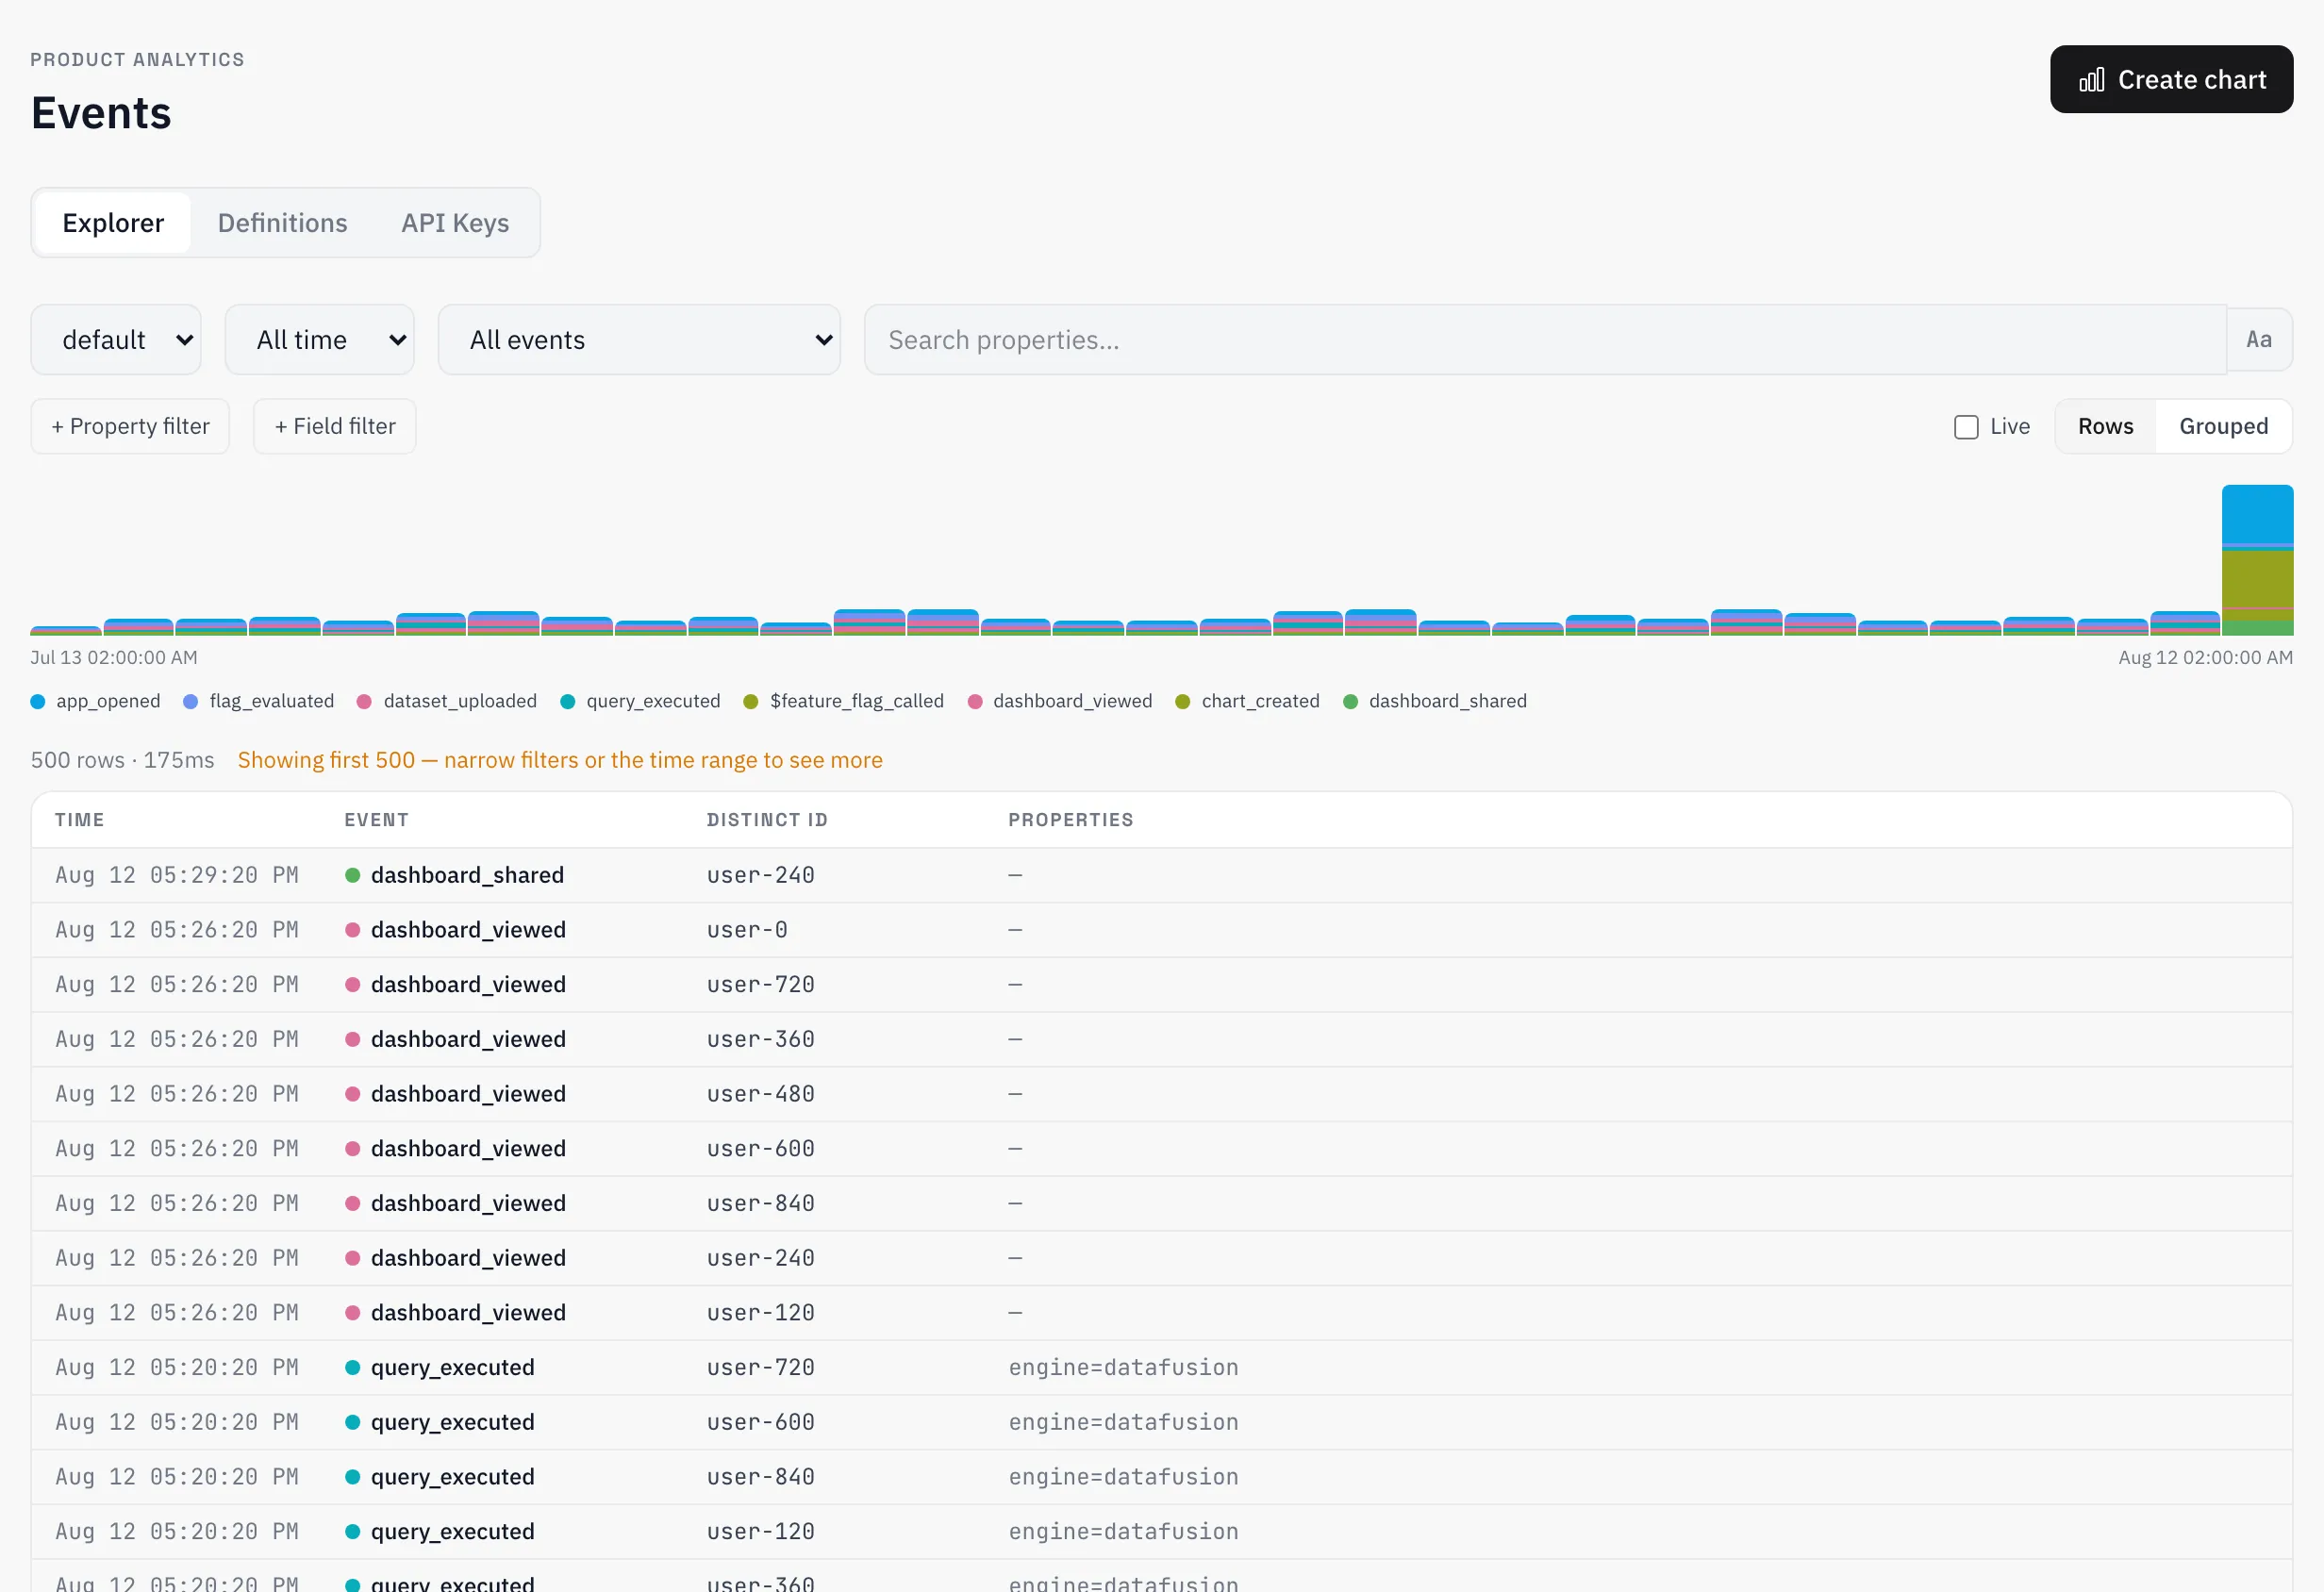
Live event stream with event names, distinct IDs and properties
LIVE EVENT STREAM WITH EVENT NAMES, DISTINCT IDS AND PROPERTIES

Visual line

Dashboards that carry their own quality state.

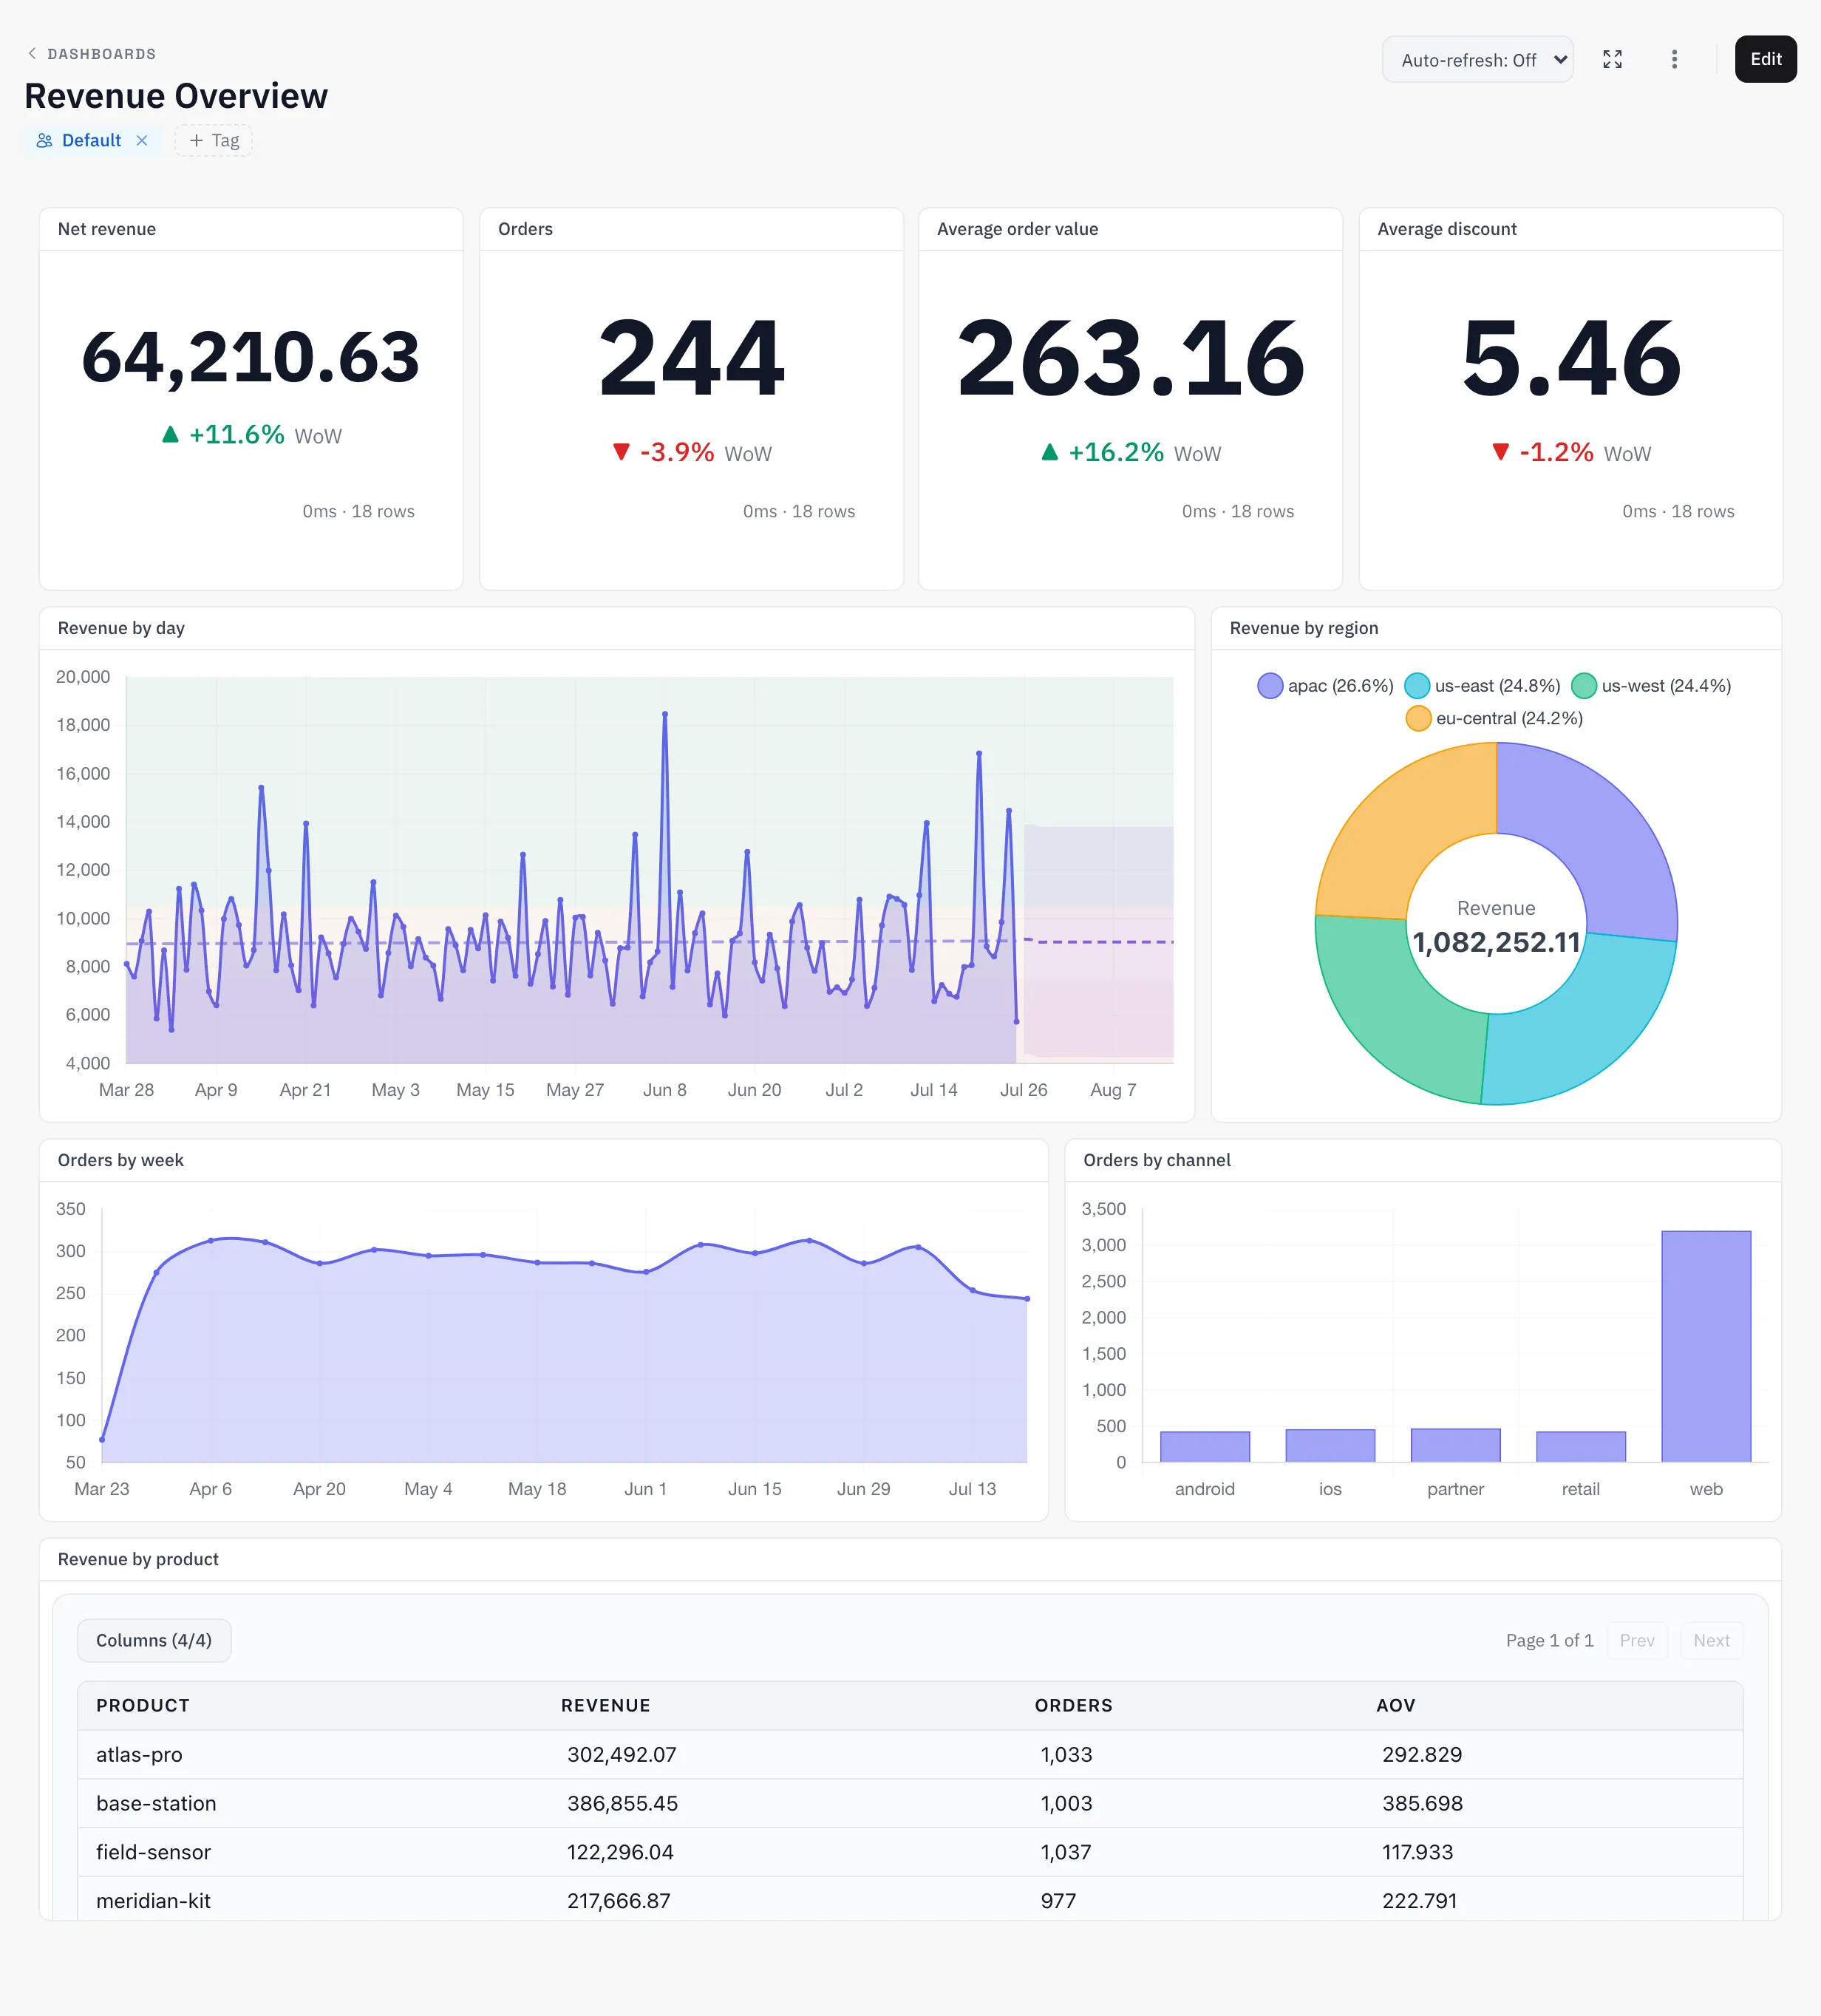
Charts, dashboards, scheduled deliveries and white-label embeds. Because publishing sits on the same substrate as ingestion, a published number arrives with the health of the data behind it attached — and because the ML machinery shares that substrate, a revenue chart can draw its own forecast.

Replaces your BI tool.

The visual line in full
  • Charts A builder over measures and dimensions — with trendlines and ML forecast overlays drawn on the chart itself.
  • Dashboards Composed from saved charts, with each number carrying its health.
  • Embeds White-label, row-scoped, tokenised per viewer.
  • Alerts Thresholds on any saved chart, delivered to Slack or email.
  • Published numbers
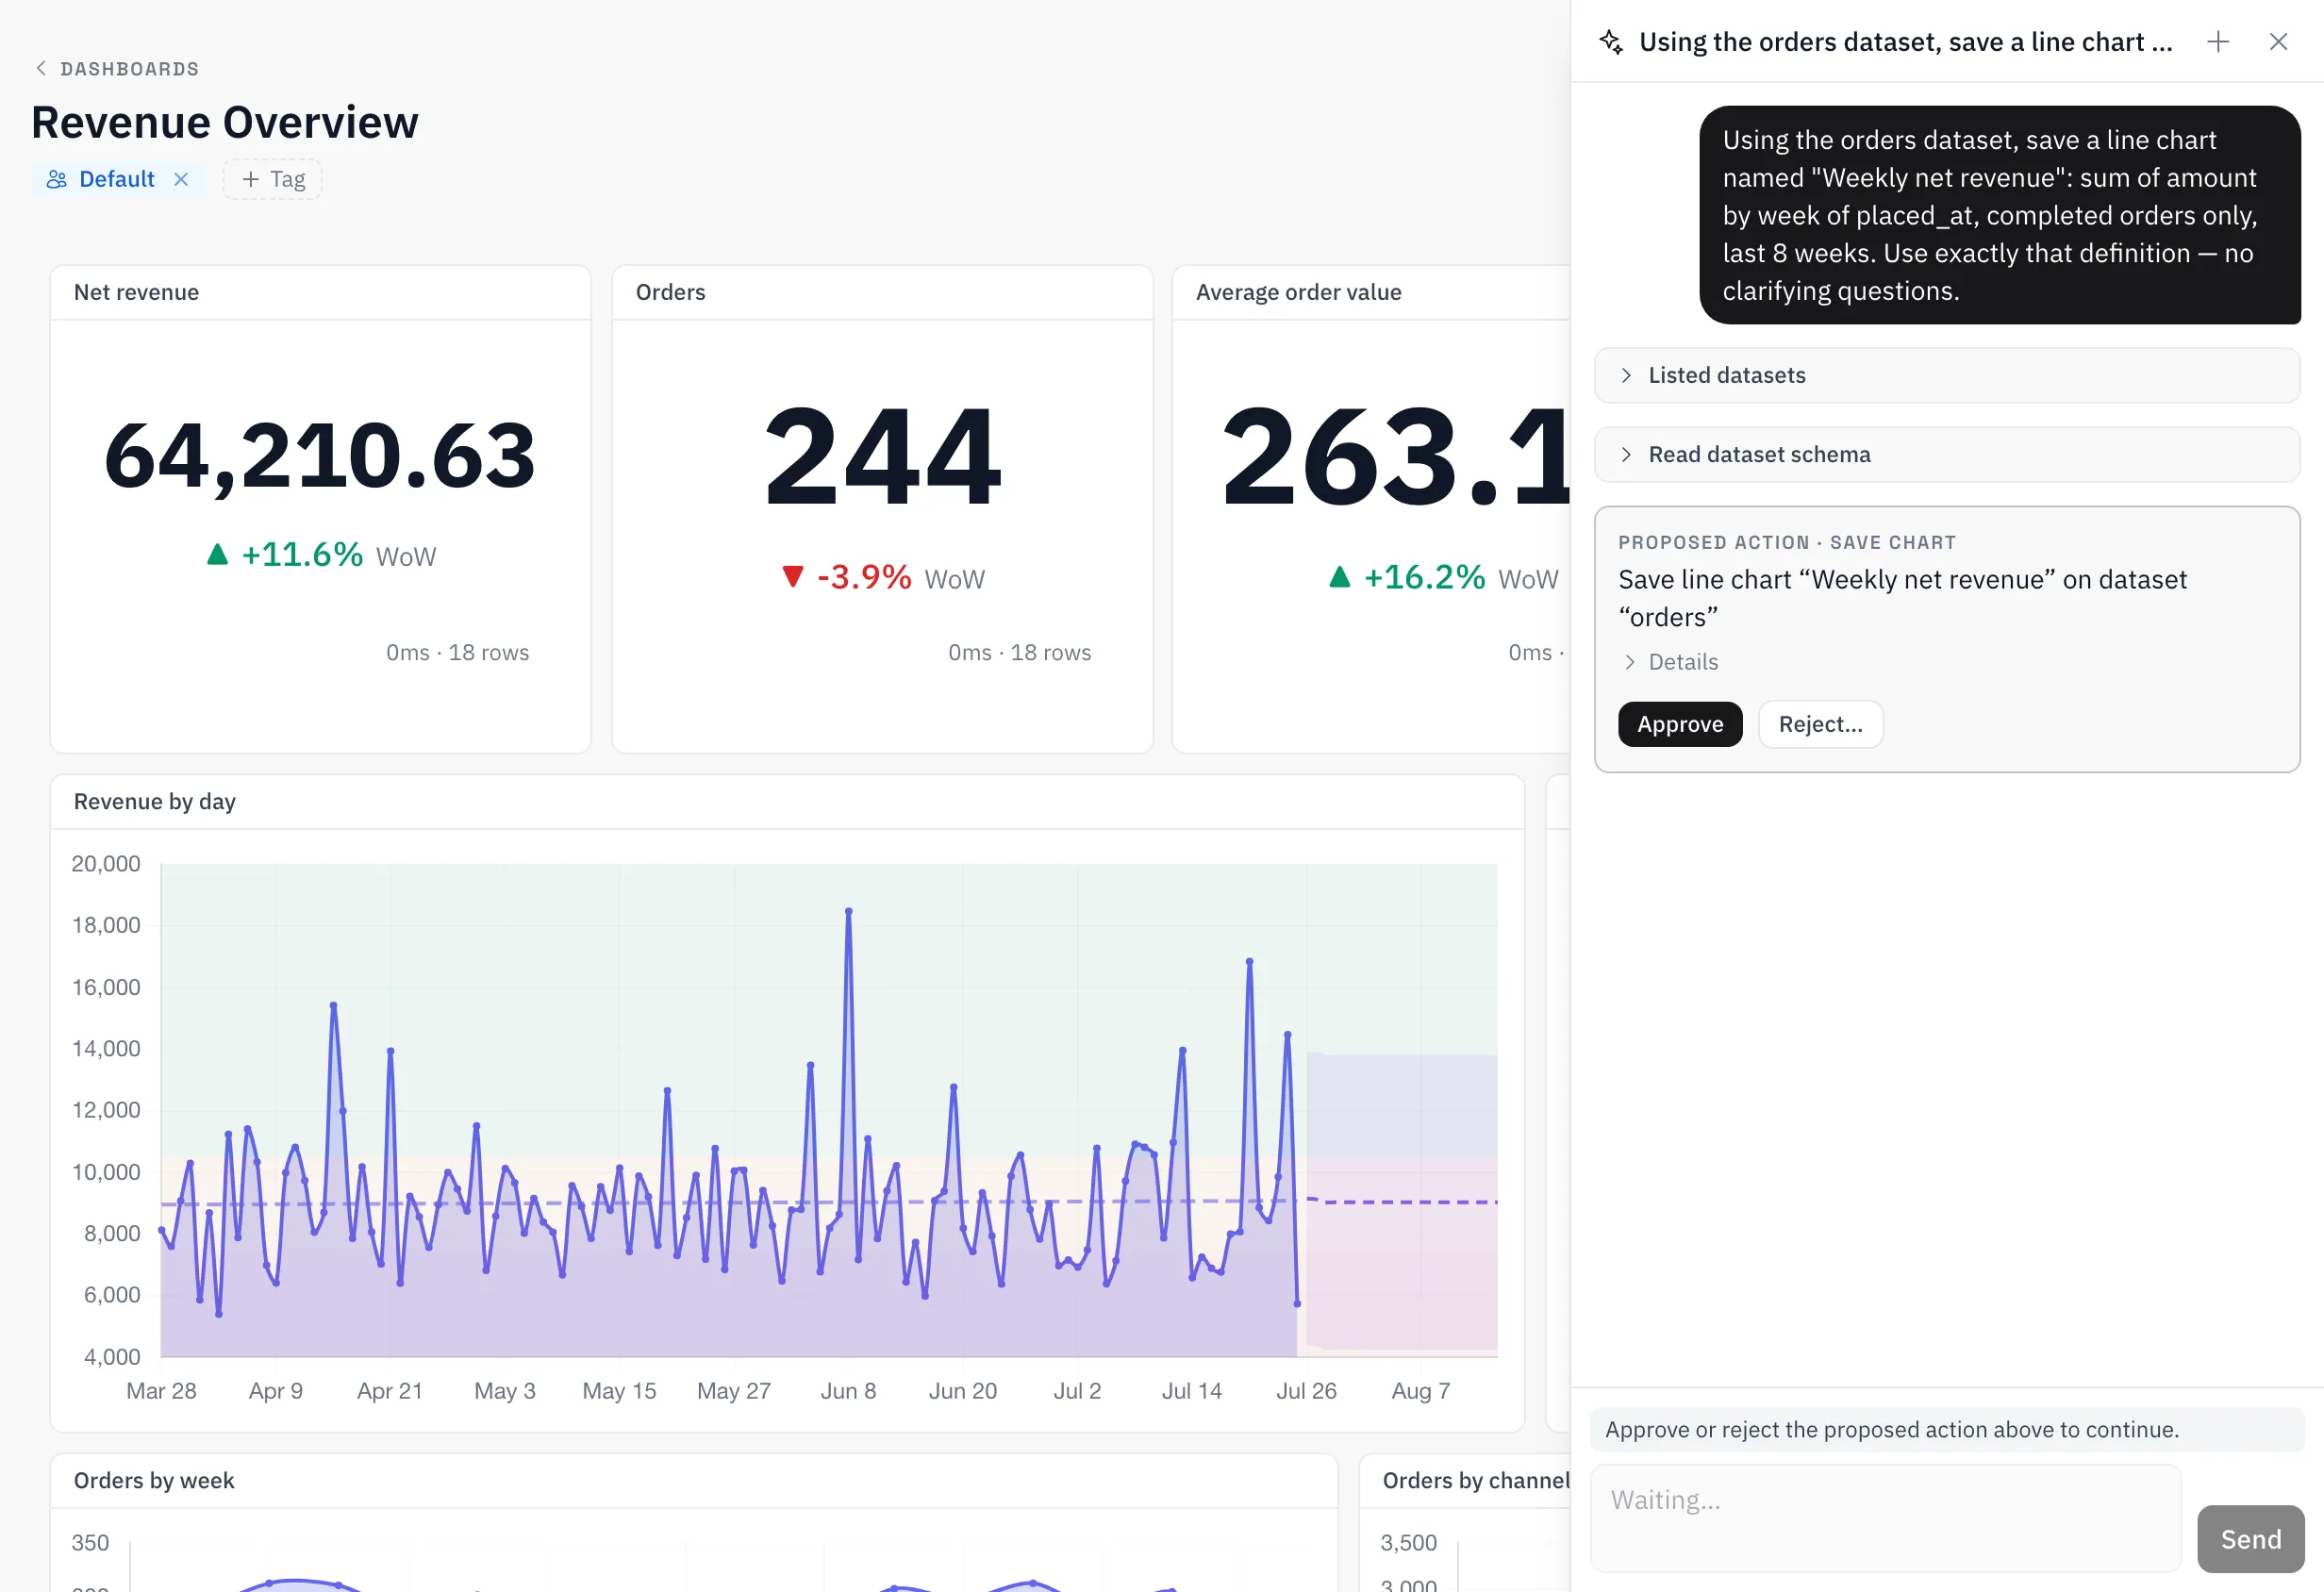
The Revenue Overview dashboard: KPIs, daily revenue across goal bands with an ML forecast, orders by channel and revenue by product
THE REVENUE OVERVIEW DASHBOARD: KPIS, DAILY REVENUE ACROSS GOAL BANDS WITH AN ML FORECAST, ORDERS BY CHANNEL AND REVENUE BY PRODUCT

Model line

Models watched by the same monitors as the data.

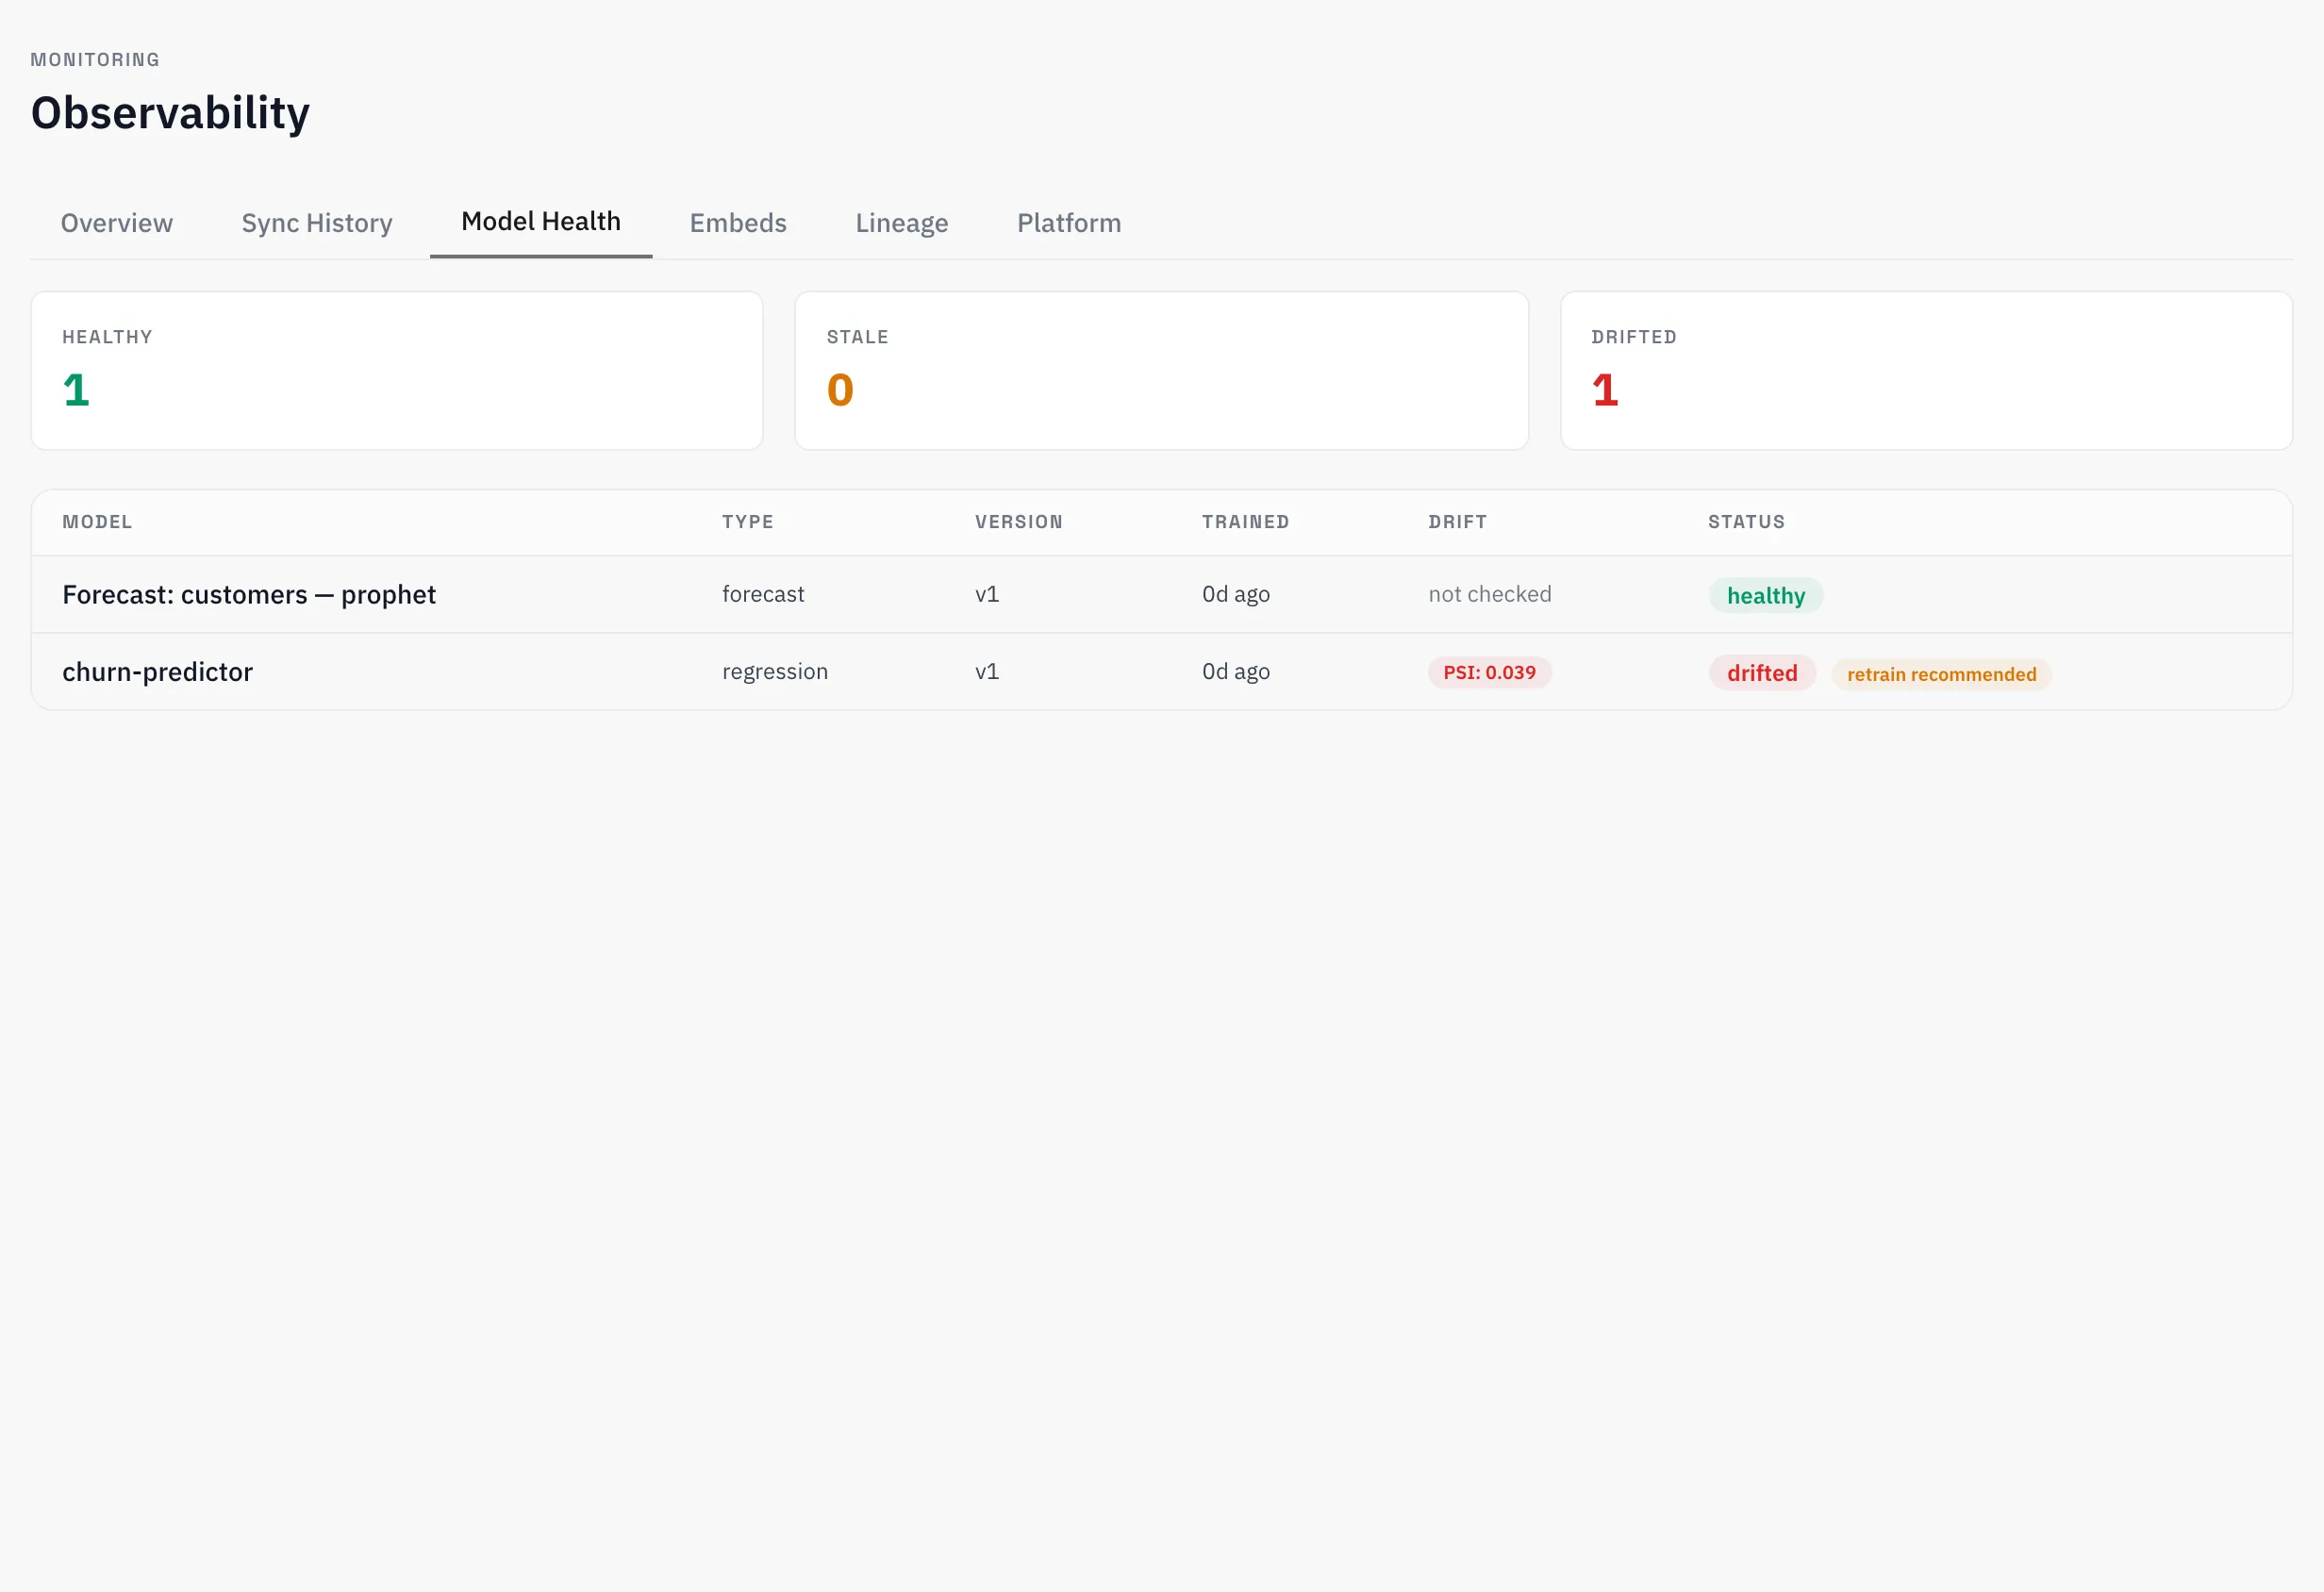
Upload an ONNX model and its predictions become another dataset — which means drift, performance and freshness are watched by the machinery already watching everything else. A model regression and a broken pipeline show up in the same place, with the same lineage behind them.

Replaces your ML-monitoring vendor.

The model line in full
  • ONNX models Bring your own model; scoring runs next to the data.
  • Drift Feature and prediction drift, tested against a reference window.
  • Performance Accuracy and calibration tracked over time.
  • Analysis Forecasts, clustering, anomaly detection and correlation.
  • Model health
Model health: drift status and per-model checks for the deployed churn model
MODEL HEALTH: DRIFT STATUS AND PER-MODEL CHECKS FOR THE DEPLOYED CHURN MODEL

Everything meets in one place.

A suite is five products sold together. A network is five services that actually share track. These five things are what make the difference, and they are the reason breadth here doesn't cost you coherence.

One lakehouse
Every line reads and writes the same Delta tables. There is no export step between your warehouse and your BI tool, because there is no second store.
One measure catalog
Net revenue is defined once. The dashboard, the funnel, the alert and the model all resolve the same definition, so two surfaces cannot quietly disagree.
One lineage graph
A number traces back through its chart and its measure to the raw source — across every line, not just the ones one vendor happened to own.
One permission model
Row filters, grants and org isolation are enforced at the storage layer, so an embed and a session replay obey the same rules.
One review process
Datasets, measures and dashboards live on branches. A change request shows the diff and the downstream impact before anyone merges.

Open underneath, so the door is never locked.

We run the infrastructure so you don't have to, but the formats underneath stay open and documented. That is the part a lean team should care about most, because it is the part that decides how expensive a mistake is.

STORAGE

Delta Lake

Open Parquet with ACID commits, managed for you. Time travel and schema history come from the format itself, so nothing proprietary holds your history.
ENGINE

DataFusion

A Rust query engine reading the tables in place — Arrow-native, with partition pruning, page indexes and a block cache over object storage.
TENANCY

Isolated by org

Every organization is a sealed workspace with its own members, datasets and permissions. Enterprise runs on a dedicated instance.
EXPORT

Open formats

Tables are standard Parquet with a Delta transaction log. Taking your data out means copying files in a documented format, not negotiating a migration.
How the lakehouse works

Four zones. No per-seat fare.

Seats are free in every zone and no feature is ever gated — what you pay for is volume, history and query priority. Charging a lean team per person to read its own numbers is how the stack got expensive in the first place.

ZONE 1

Free

$0

per month

The whole network, hosted, with hard caps instead of a surprise bill.

ZONE 2

Plus

$29

per month

More headroom, a year of event history, and unbranded embeds.

ZONE 3

Professional

$199

per month

Priority engine, two years of history, and bring-your-own AI key.

ZONE 4

Enterprise

Custom

annual

A dedicated instance, SSO, an SLA and white-label embeds.

Full fare table

This is the end of the line.

Bring one CSV and a question. You can have a dashboard whose numbers you are willing to defend before the end of the afternoon — and a pipeline keeping it current by tomorrow.

AZ-Five