Data changes go through review, the way code does.
A measure is defined once and reused everywhere. Changing one opens a change request with the diff and the blast radius. And every published number traces back through its chart and its measure to the raw source.
Define a metric once. Argue about it never.
The measure catalog is the one place net_revenue is defined. Dashboards, funnels, alerts and models all resolve the same definition, so two surfaces cannot quietly disagree — and when the definition changes, everything downstream changes together.
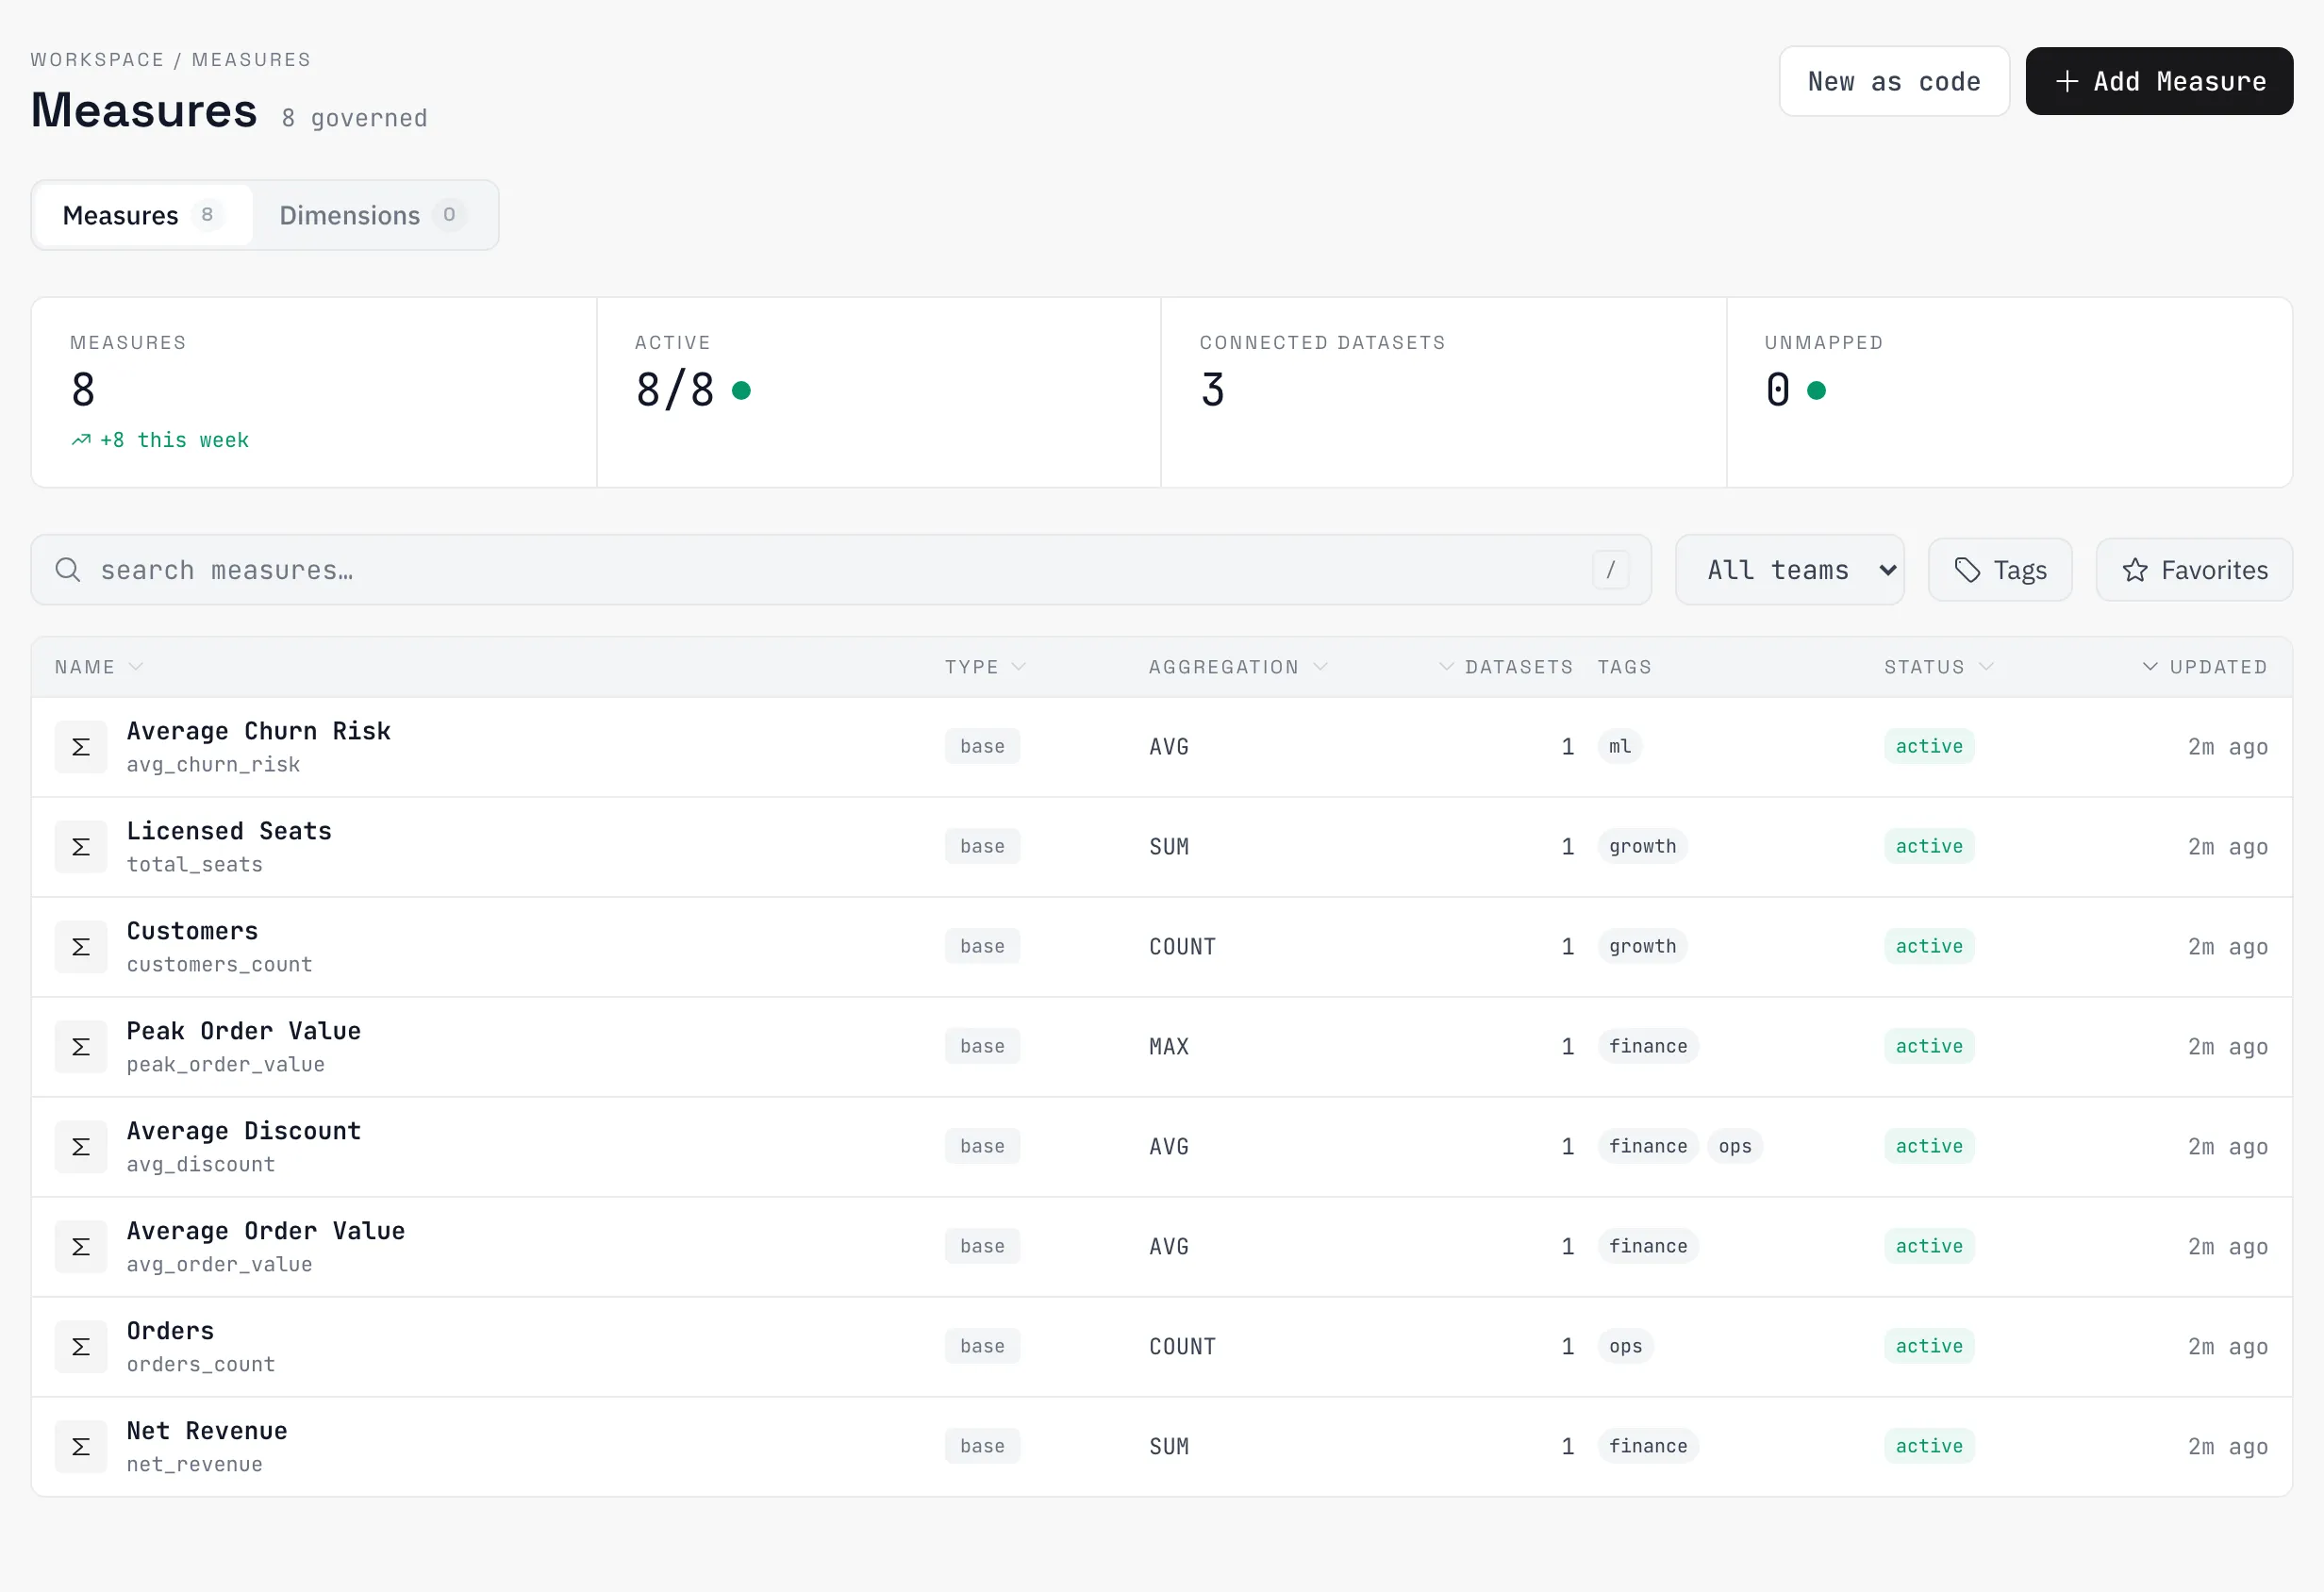
Bring the dbt project you already have.
An existing dbt project imports without a rewrite: models become datasets on the lakehouse, and their definitions join the same catalog and the same lineage graph as everything else. Migration is an afternoon, not a quarter.
Branches for data. Reviews for changes.
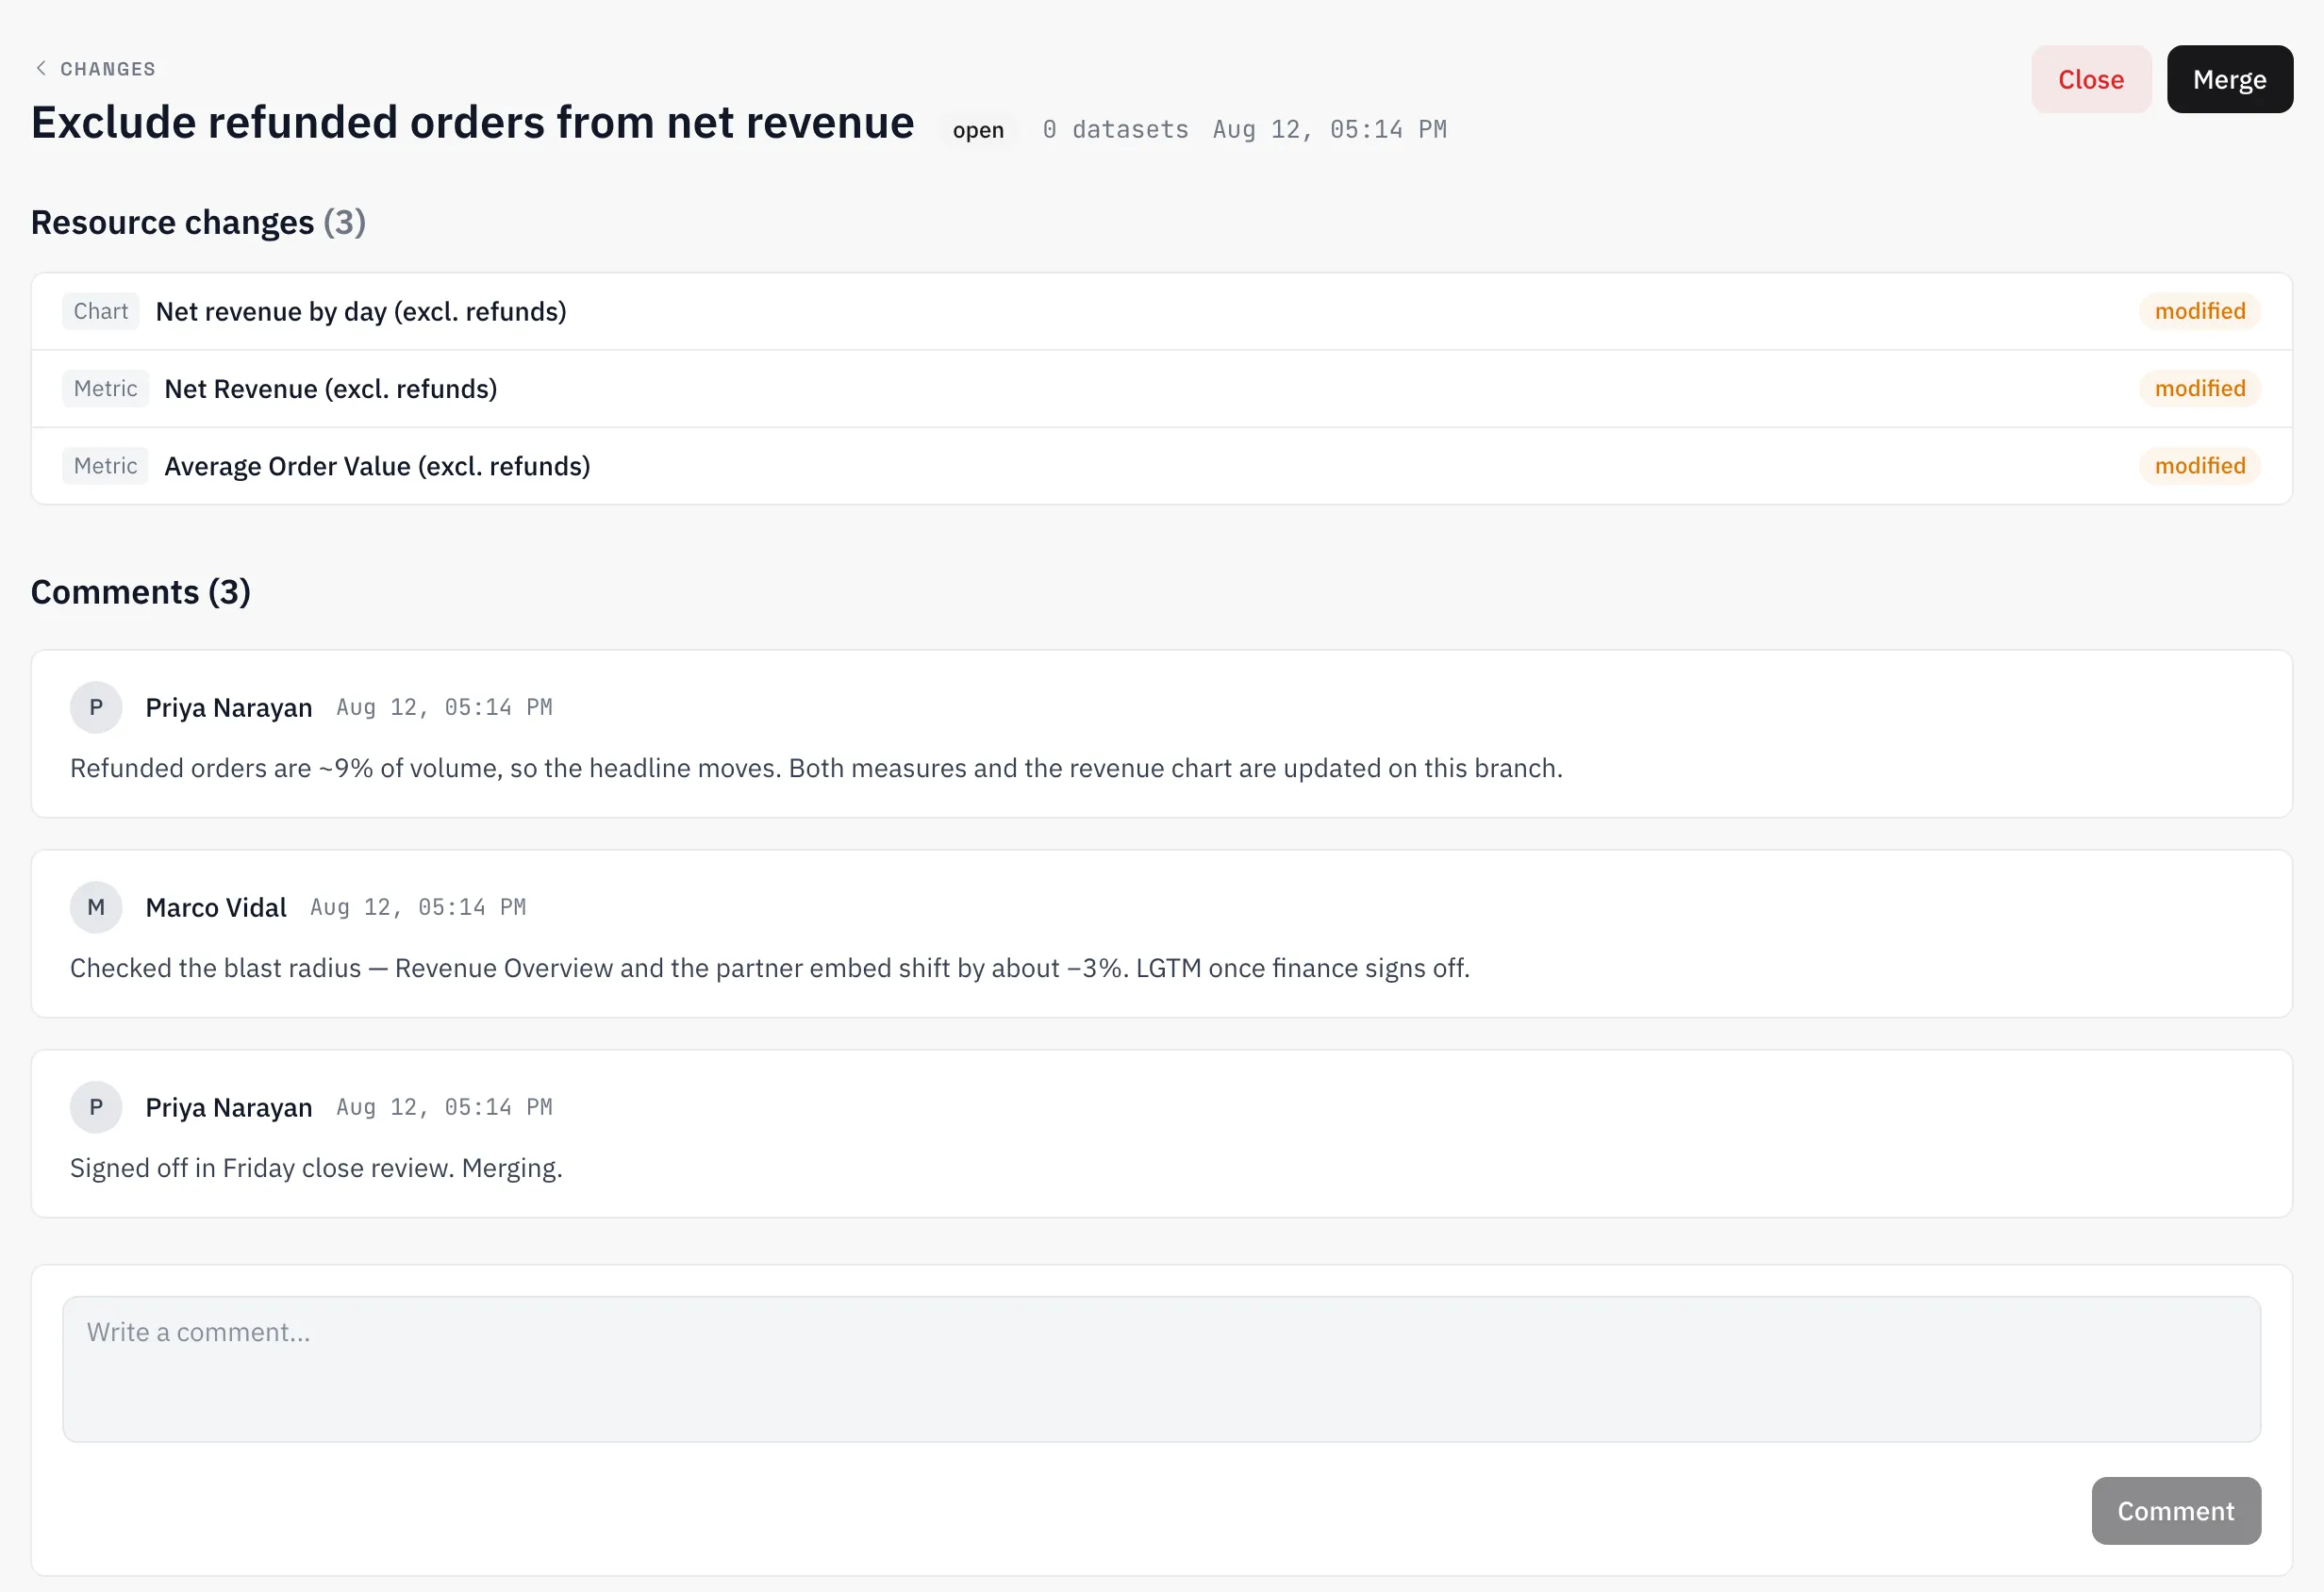
Datasets, measures and dashboards live on branches, like code. Edit on a branch and the change collects into a change request — the diff, the affected resources, and a merge that lands everything at once or not at all. Nothing edits production silently.
DIFF · DOWNSTREAM IMPACT · MERGE OR CLOSE
Every number, traceable to its source.
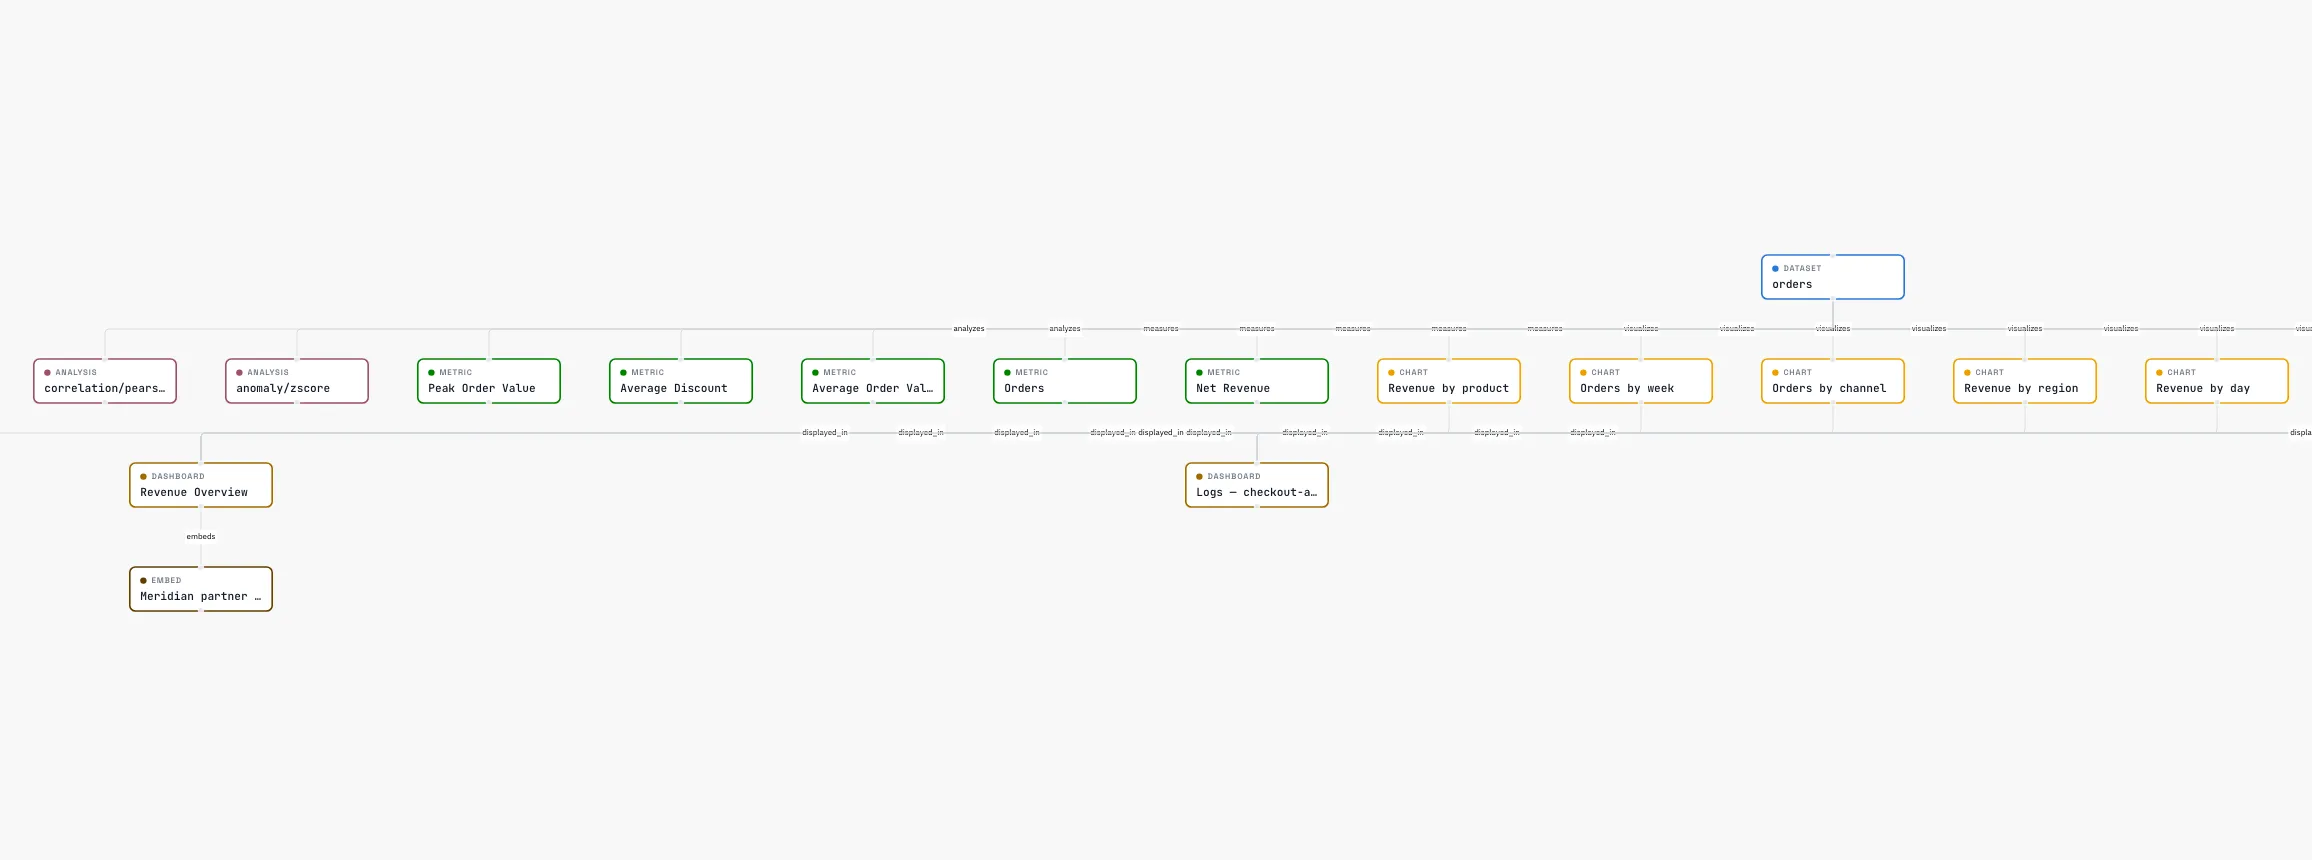
One graph connects five layers. Ask any published number where it came from and the answer is a path, not a meeting — and because quality state rides the same edges, the graph also answers what a failure is about to break.
- Dataset The Delta table a load produced, with its quality state.
- Measure The governed definition — net_revenue means one thing here.
- Chart Every chart resolving that measure, across every surface.
- Dashboard The composition a stakeholder actually reads.
- Embed + model White-label embeds and scoring models, in the same graph.
Where this line interchanges.
Governance without a platform team.
Define your first measure and watch every chart that uses it stay honest.