Dashboards
Arrange saved charts into shared dashboards, publish them to teams, schedule Slack or email snapshot deliveries, and set threshold alerts on any chart.
A dashboard arranges saved charts into one live view. The dashboard stores the layout and filters; the charts stay independent resources with their own access rules — sharing a dashboard never quietly widens access to the data behind it.
Compose a dashboard
Create a dashboard, then add saved charts as tiles and arrange them on the grid. Global filters apply to every chart at once, and dashboard filter widgets resolve to per-chart column filters on top of them. An optional auto-refresh interval keeps the view current without reloading.
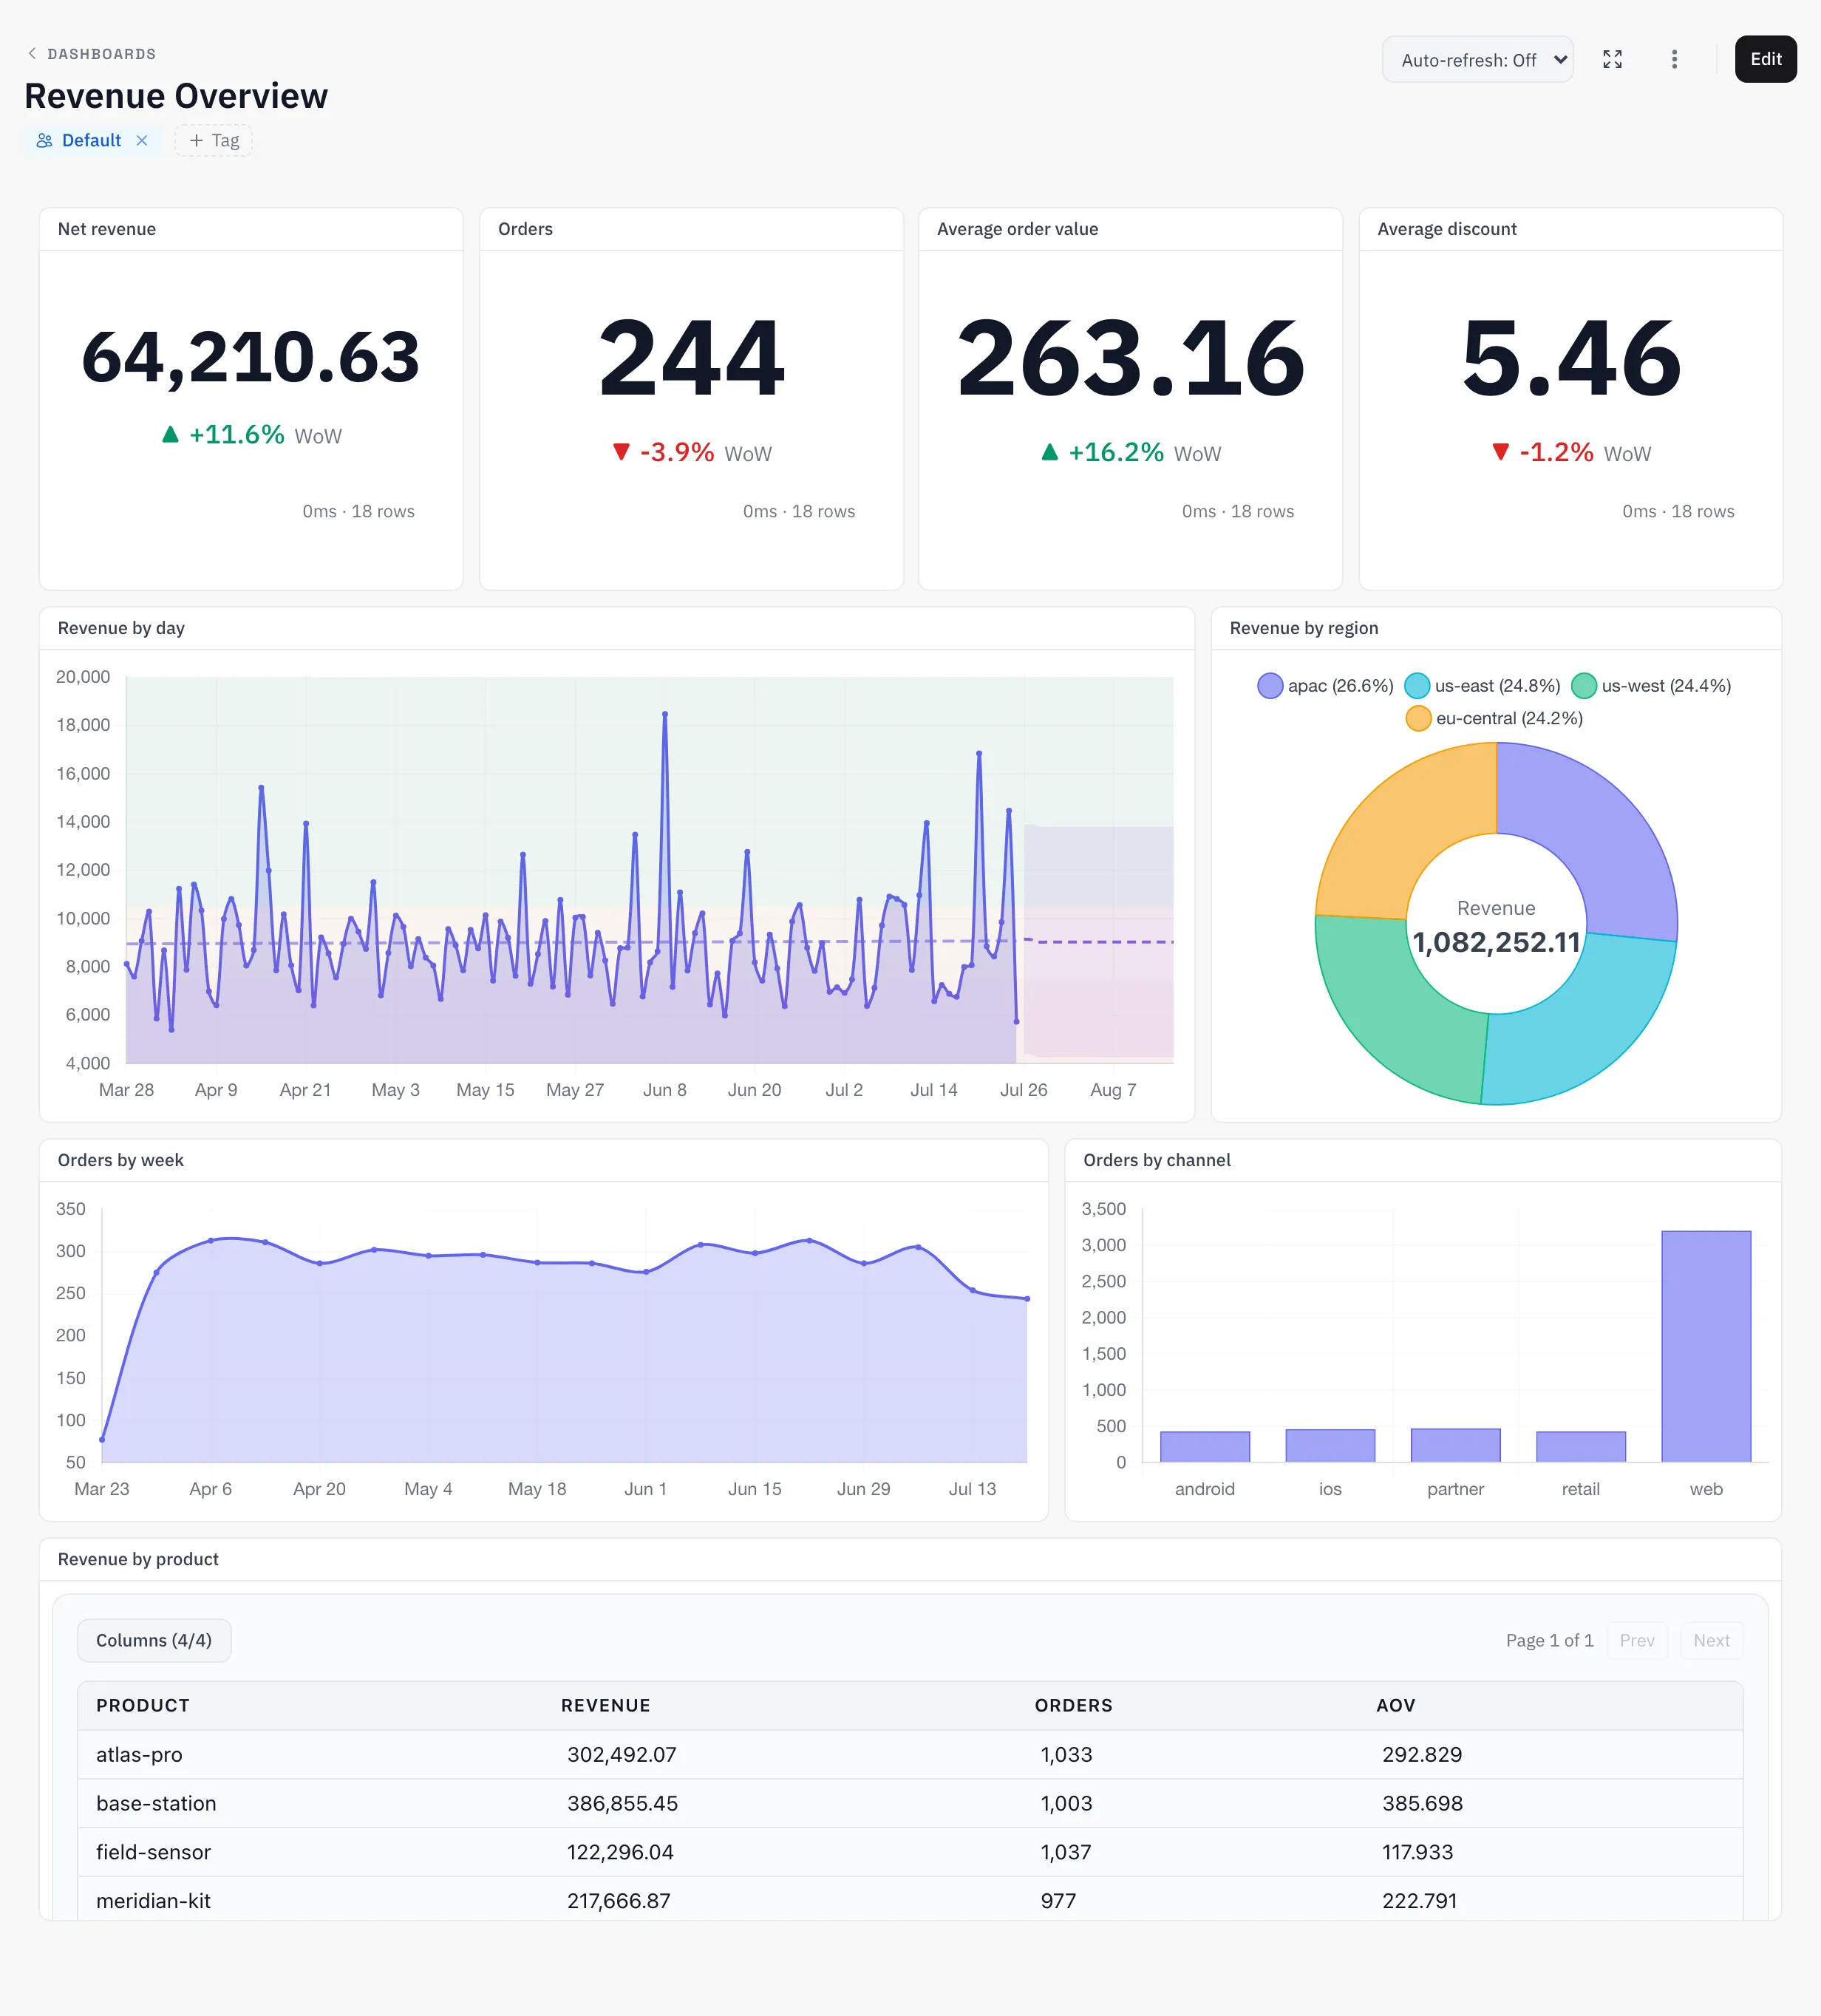
Opening a dashboard loads everything in one request, not one per tile — the dashboard, its charts, and dataset summaries together. Rendering is batched and streamed too, one result per chart as each finishes, so fast tiles appear immediately and one failing chart never blanks the rest.
Every chart still authorizes individually. A tile whose chart you cannot read comes back as {"accessible": false} and shows a locked state — no metadata, no data.
Share with your team
Dashboards belong to a team. Publishing shares one to another team at read, write, or manage level; publishing requires the publish capability and manage access on the dashboard itself. Viewers see the tiles their own access allows — publishing the dashboard does not grant the underlying charts or datasets.
Schedule deliveries (Slack/email)
A subscription delivers a chart or a whole dashboard as a PNG snapshot on a schedule — to a Slack channel (with the org’s Slack integration connected) or to a list of email recipients. Schedules are either an interval or a cron expression, and a delivery can be sent immediately to test.
Snapshots are rendered by a background worker under the row scope of the person who created (or last edited) the subscription — a delivery shows exactly what that person is allowed to see, nothing more. The subscriptions list reports each delivery’s last run, last status, and next fire time, and flags when the snapshot worker is offline with deliveries queued.
Alerts on charts
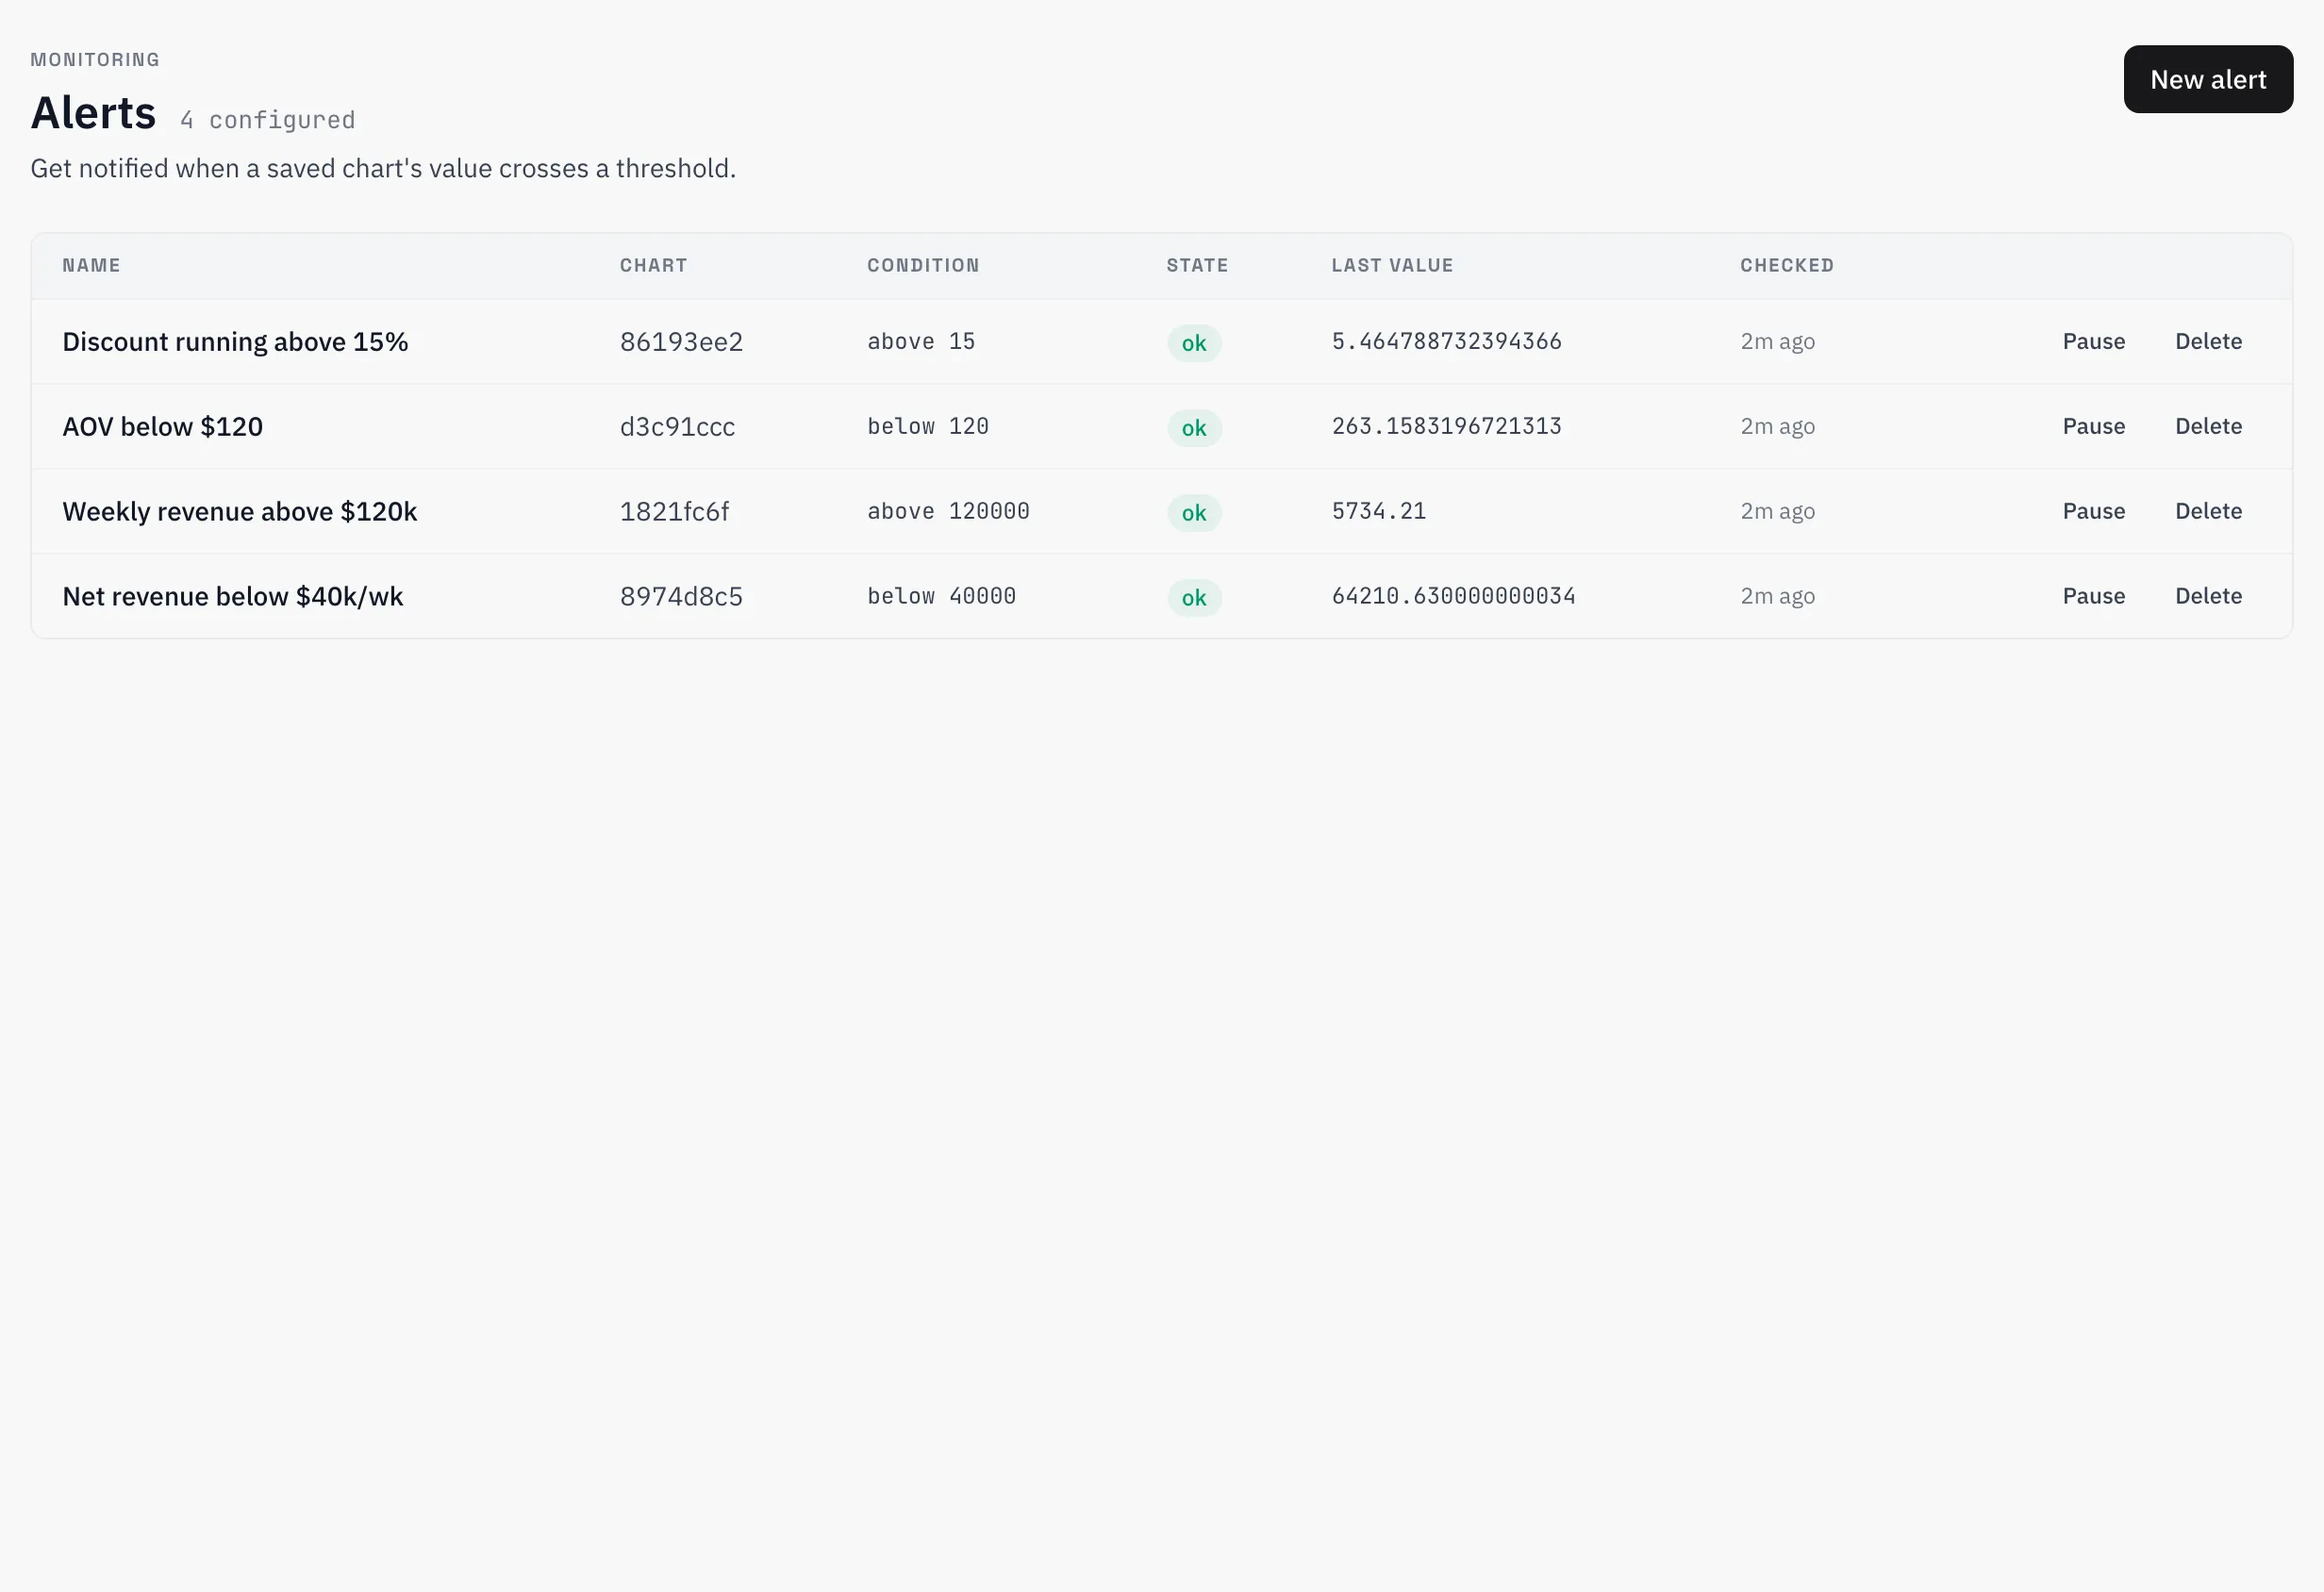
A threshold alert watches a saved chart’s value and notifies when it crosses a line:
- Condition —
aboveorbelowa numeric threshold. - Check interval — every 1 minute to 24 hours (default 60 minutes).
- Channels — in-app notification, Slack, email; any combination.
Alerts fire on the transition into breach — not repeatedly while a breach persists — and, when recovery notification is enabled, once more when the value returns to normal. A test action evaluates the rule immediately as a dry run, under your own row scope, without notifying anyone or touching the rule’s state.
Creating an alert requires read access to the chart; evaluation renders as the alert’s creator, so only the creator or an org admin can modify a rule — silently re-scoping an alert to someone else’s row visibility would be a leak.